Method and system for monitoring the performance of a distributed application

a distributed application and performance monitoring technology, applied in the field of online monitoring of the performance of a computer system, can solve the problems of slow or poor performance of a distributed application, degradation or failure of the service of the distributed application, and the complexity of the delivery protocol such as the http of content over the intern

Inactive Publication Date: 2011-10-04
CLOUDING
View PDF9 Cites 89 Cited by
  • Summary
  • Abstract
  • Description
  • Claims
  • Application Information

AI Technical Summary

Benefits of technology

[0020]In accord with the present invention, a method is defined for determining one or more performance metrics for a distributed application. In the method, distributed application data are transferred from a second site to a first site over a network in response to a request from the first site that is transmitted to the second site. As used herein the term “distributed application data” is simply a broader category that includes a Web page. Although the Description of the Preferred Embodiment that follows is primarily directed to determining performance metrics in regard to the transfer of a Web page from a server and its rendering on a client computer, it should be understood that the present invention is more generally intended to encompass the determination of performance metrics for any type of distributed application and for other types of computing devices. As explained below, the first site may include a client computer on which a browser program is running. A user of the client computer may request a specific Web page be downloaded from a server and displayed by the browser program. In response to the request, the distributed application data, e.g., the HTML instructions defining a Web page, are transferred from the second site to the first site over the network, if not already accessible in a cache at the first site. To avoid the need for the user to explicitly install a performance monitoring program, machine instructions that define a performance monitoring function are included with the distributed application data that were requested and both the machine instructions and the distributed application data are transmitted over the network to the first site. The machine instructions are then executed at the first site, automatically and transparently, to implement the performance monitoring function used to determine the one or more performance metrics for the distributed application. In addition, the performance of the second site is determined and combined with at least one performance metric determined at the first site, in the case of a correlated performance metric.
[0021]The performance monitoring function is preferably initiated when the distributed application data are accessed at the first site. The method also includes the step of collecting performance metrics for the distributed application over the network. Optionally, a probabilistic sampling parameter can be applied to determine whether performance metrics are collected from a plurality of sites at which the performance monitoring function is being implemented. This technique enables a sampling of the performance metrics, which can be applied on a per-session basis, or on a per-request basis to reduce the performance metric data that are processed.

Problems solved by technology

A significant problem for users and providers of network services can be the slow or poor performance of a distributed application.
However, measuring the delivery via protocols such as HTTP of content over the Internet is complicated by the federated nature of the Internet (compared to LANs or intranets), because the overall performance of the system depends not only on infrastructure that is directly controlled by the application provider, but also by a multitude of third parties.
Problems in any of these third party providers can lead to distributed application service degradation or failure, but the number of providers involved and the limited visibility that an application provider generally has into these independently administered systems commonly makes service problems particularly difficult to detect and diagnose.
Although secondary metrics can be very informative, they do not enable an administrator to understand the level of service that the application end users have experienced.
Although those responsible for maintaining a distributed application are generally concerned with the performance delivered to end users, they are typically severely restricted in doing so, because of the limited resources at their disposal for detecting and diagnosing the full range of performance problems that impact end users.
These management tools are effective for delivering system and network metrics, but they are generally not able to deliver application level metrics.
As a result, the administrators of the distributed applications typically do not have adequate information to detect or diagnose performance problems experienced by end users, or other service problems experienced by end users, or to evaluate the health and performance of the inter-network through which the application servers are connected to the end users.
However, this solution is frequently inappropriate for the following reasons:For Web browsing on the Internet, end users commonly prefer not to download and install desktop performance monitoring programs, due to security and privacy concerns.
The prior art does not teach or suggest how to determine compound metrics.
However, although these solutions deliver ample usage information, they fail to deliver the performance information that is required to support more effective detection and deeper diagnosis of distributed application service problems.
HitBoX™ uses JavaScript annotations to HTML Web pages to collect page usage metrics, but does not determine or collect performance metrics.
These software solutions are limited in that they cannot determine or collect compound metrics or correlated metrics.
They are also limited in the scope of their event-based metric collection.
Finally, they are unable to tolerate common error or environmental conditions, such as network partitions.
However, a MUM agent must be explicitly installed on each monitored computer or node and is not capable of being implemented without having administrative control over the entire network, or the cooperation of the end users in installing the agents.
The patent also discloses that other performance parameters can be determined by the browser agent, but does not provide any details about what those performance parameters are or how they are determined.
Moreover, the invention disclosed by this prior art reference does not enable a correlated or compound performance metric to be determined for the distributed application, because it does not disclose determining a performance component for the Web server that might be combined with a performance parameter determined by the browser monitor.
Furthermore, the prior art approach is deficient, because it is not transparent to (i.e., hidden from) the end user.

Method used


Image

  • Method and system for monitoring the performance of a distributed application
  • Method and system for monitoring the performance of a distributed application
  • Method and system for monitoring the performance of a distributed application

Examples


Embodiment Construction

Overview

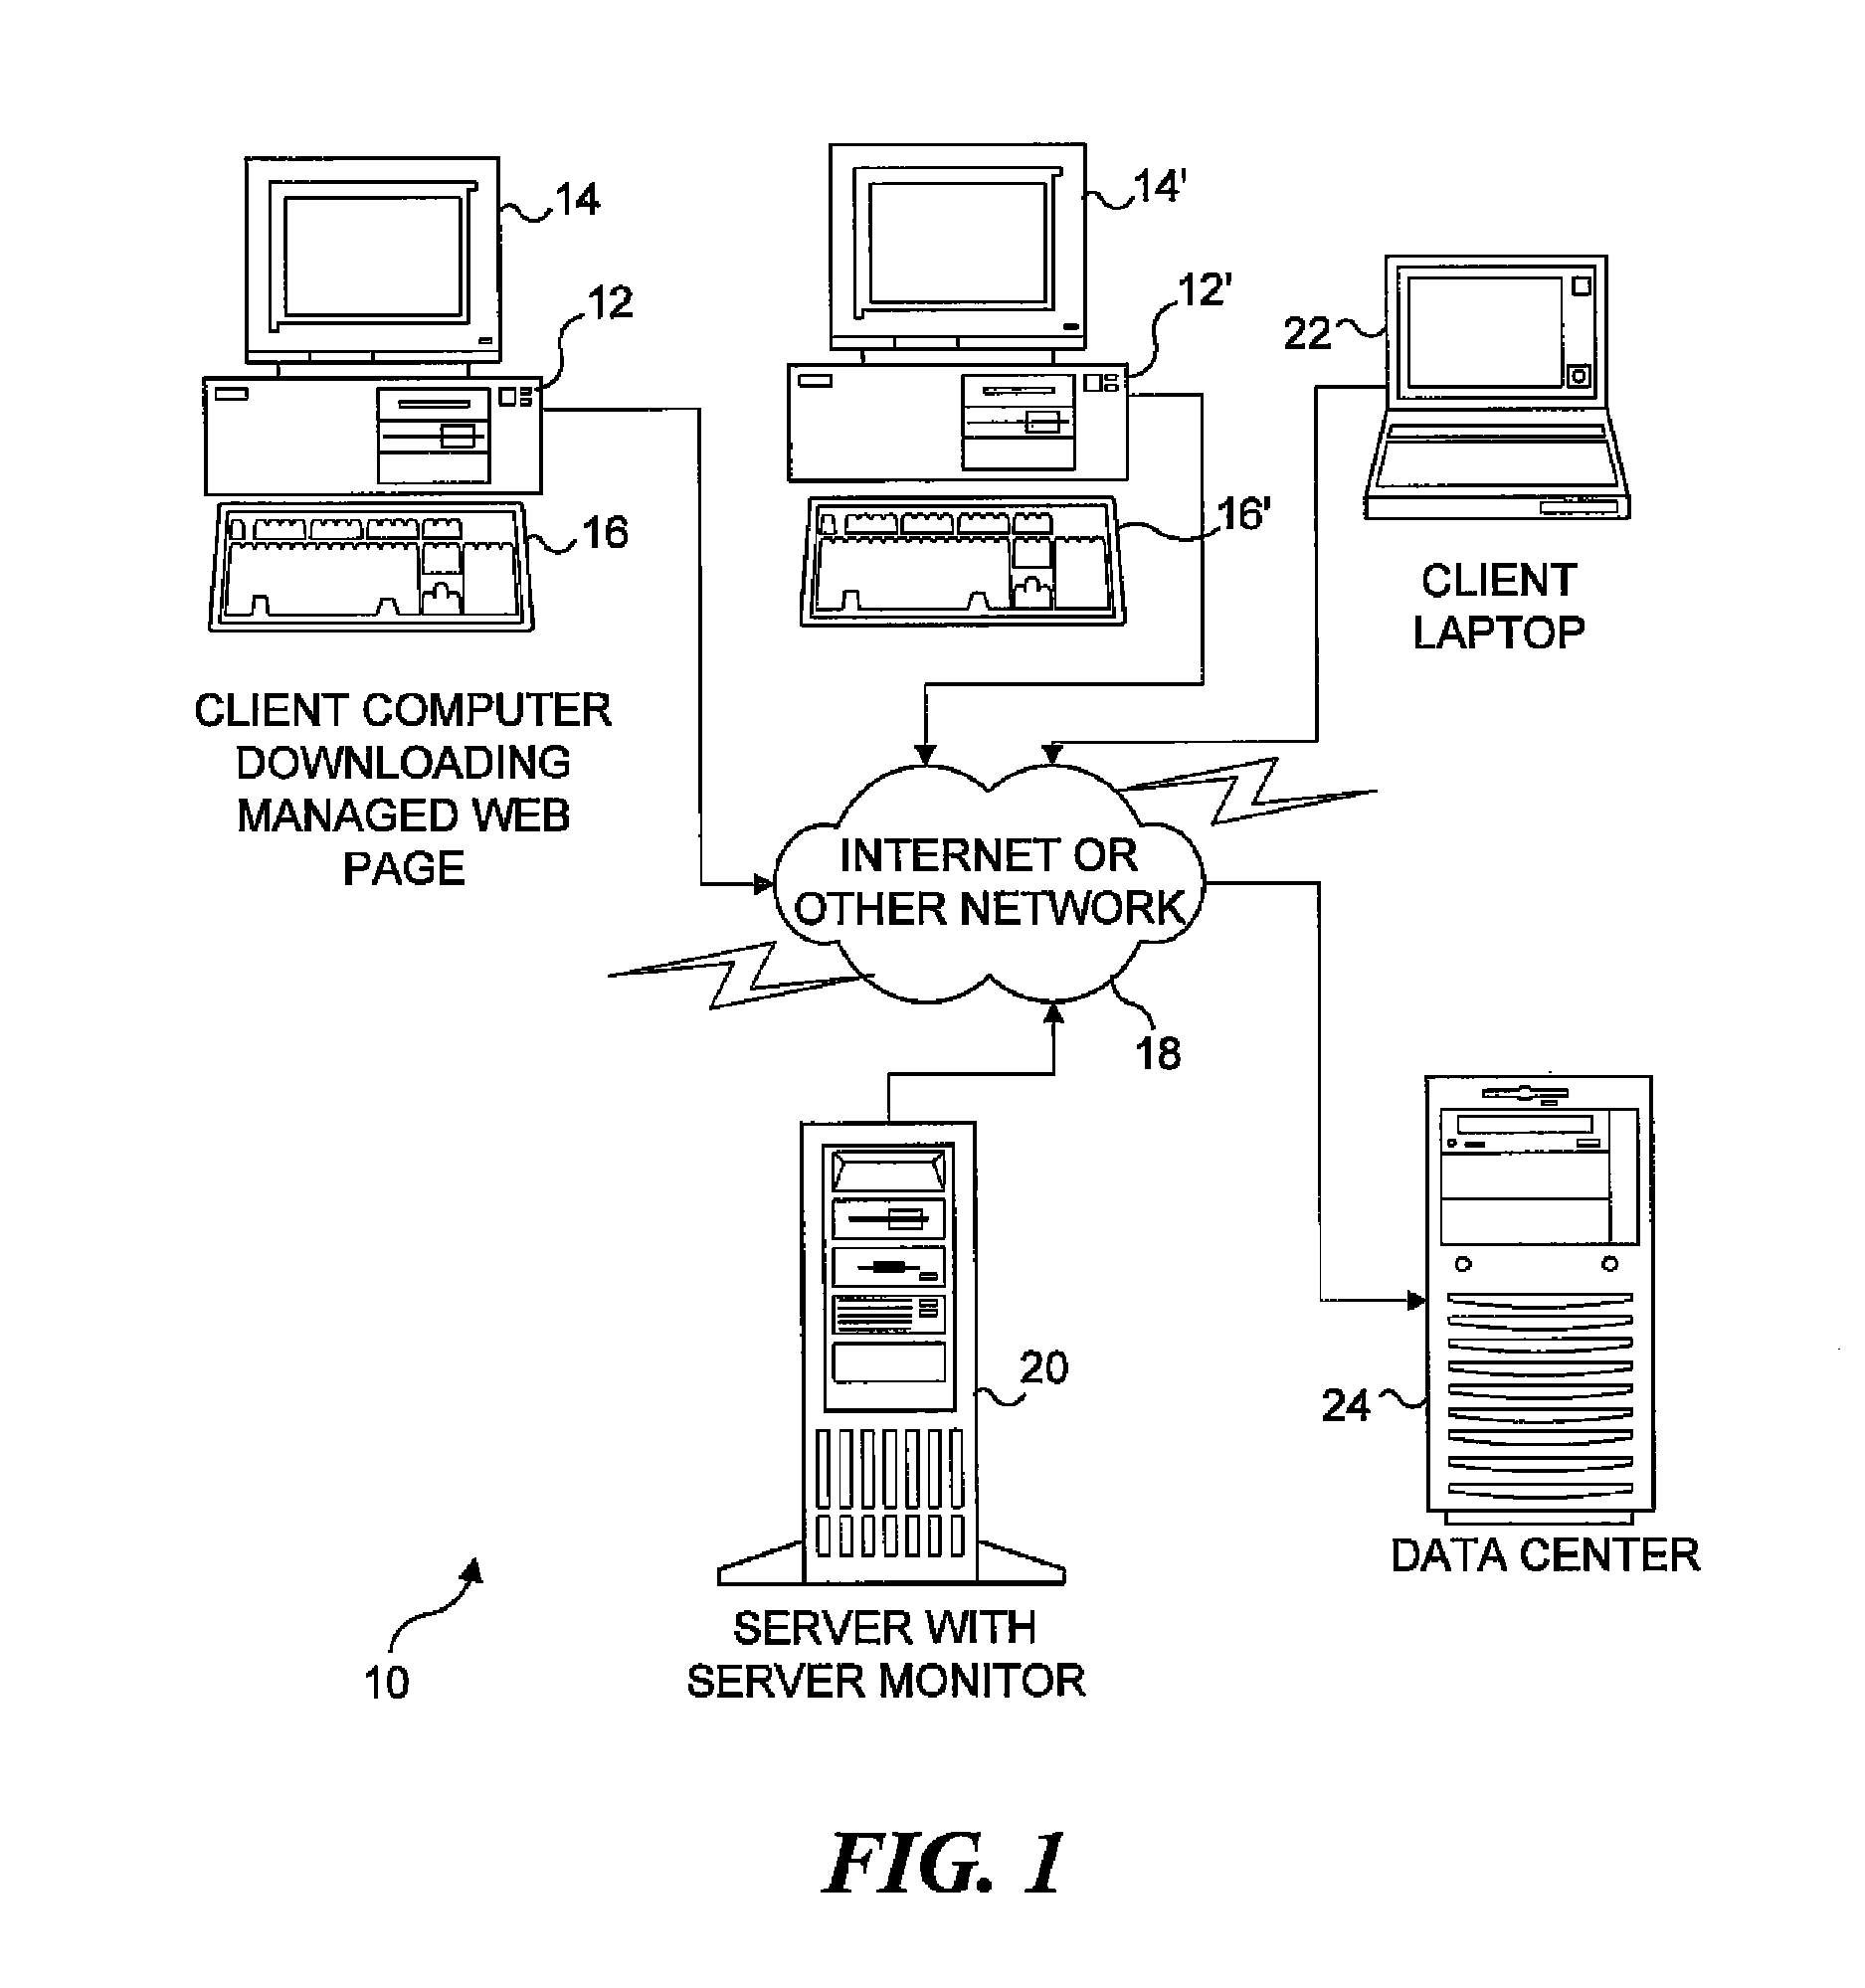
[0037]The present invention is employed for monitoring performance, usage, and availability metrics for a distributed application. As a special case discussed below, the present invention supports measurement of performance metrics for distributed applications based on HTML (i.e., a Web page) delivered using HTTP as the application level transport protocol. Examples of points at which such monitoring of performance may occur include Web servers, Web browser programs, and caching proxies located on a path between the servers that supply the content and a client access device that receives the content.

[0038]The measurement system of the present invention preferably includes two types of monitoring elements. The first type is a server monitor that resides on a server responsible for the creation of content. Alternatively, the server monitor function occurs in a Web caching proxy. In another alternative, both a server monitor and a Web caching proxy monitor may be used. In gener...


PUM


Abstract

A service monitor and a browser monitor determine performance metrics on both a server and a client in connection with a distributed application running on a network. While applicable to other types of distributed application data, an example is described in which a Web page is requested by a user running a browser program on the client computer. In response, the server transmits the requested Web page, along with JavaScript code that defines a browser monitor, to the client. A browser monitoring function controlled by this code determines a plurality of different performance metrics related to the access of Web pages by the client. In addition, the server monitor determines performance metrics specific to its function in providing the Web page to the client. A correlated performance metric is determined by combining a server performance metric with a browser performance metric.

Description

RELATED APPLICATIONS[0001]This application is a continuation of U.S. application Ser. No. 09 / 991,127, filed 14 Nov. 2001, which claims the benefit of U.S. Provisional Application No. 60 / 249,134, filed 16 Nov. 2000, the disclosures of each of which are incorporated, in their entirety, by this reference.FIELD OF THE INVENTION[0002]The present invention generally relates to the online monitoring of the performance of a computer system in regard to a distributed application, and more particularly, to monitoring of the performance of a distributed application using data determined at a recipient computing device that is accessing the distributed application data.BACKGROUND OF THE INVENTION[0003]A distributed application is a software system that runs on two or more computers connected by a computer network. Client-server computing is a special case of distributed application computing. With the growth of the World Wide Web (WWW), interactive distributed applications have become a substan...

Claims


Application Information

Patent Timeline
Patent Type & Authority Patents(United States)
IPC IPC(8): G06F15/16G06F15/177H04L12/24H04L29/08
CPCH04L67/02H04L69/329H04L41/5009H04L41/509H04L41/5096H04L67/142
Inventor RUSSELL, ETHAN GEORGECOTE, STEPHEN WILLIAMAIKAS, ERKKI VILLE JUHANIMARSH, BRIAN DAVIDCHEN, JOHN BRADLEY
Owner CLOUDING
Why Eureka
Try Eureka