Graphical analysis of states in a computing system

a computing system and state analysis technology, applied in the field of computing systems, can solve the problems of affecting the operation of the system, etc., and achieve the effects of reducing the difficulty of diagnosing the causes of such problems, and improving the efficiency of the system

Active Publication Date: 2012-10-09
SYMANTEC OPERATING CORP
View PDF7 Cites 17 Cited by
  • Summary
  • Abstract
  • Description
  • Claims
  • Application Information

AI Technical Summary

Benefits of technology

[0012]In one embodiment, log data entries in the central repository may include a “log sequence number”. Each entry has an associated log sequence number which is monotonical...

Problems solved by technology

Downtime associated with such systems can be disastrous.
Because downtime in an organization can severely impact operations, the ability to deploy additional servers, replace failed servers, or restore a previous ...

Method used


Image

  • Graphical analysis of states in a computing system
  • Graphical analysis of states in a computing system
  • Graphical analysis of states in a computing system

Examples


Embodiment Construction

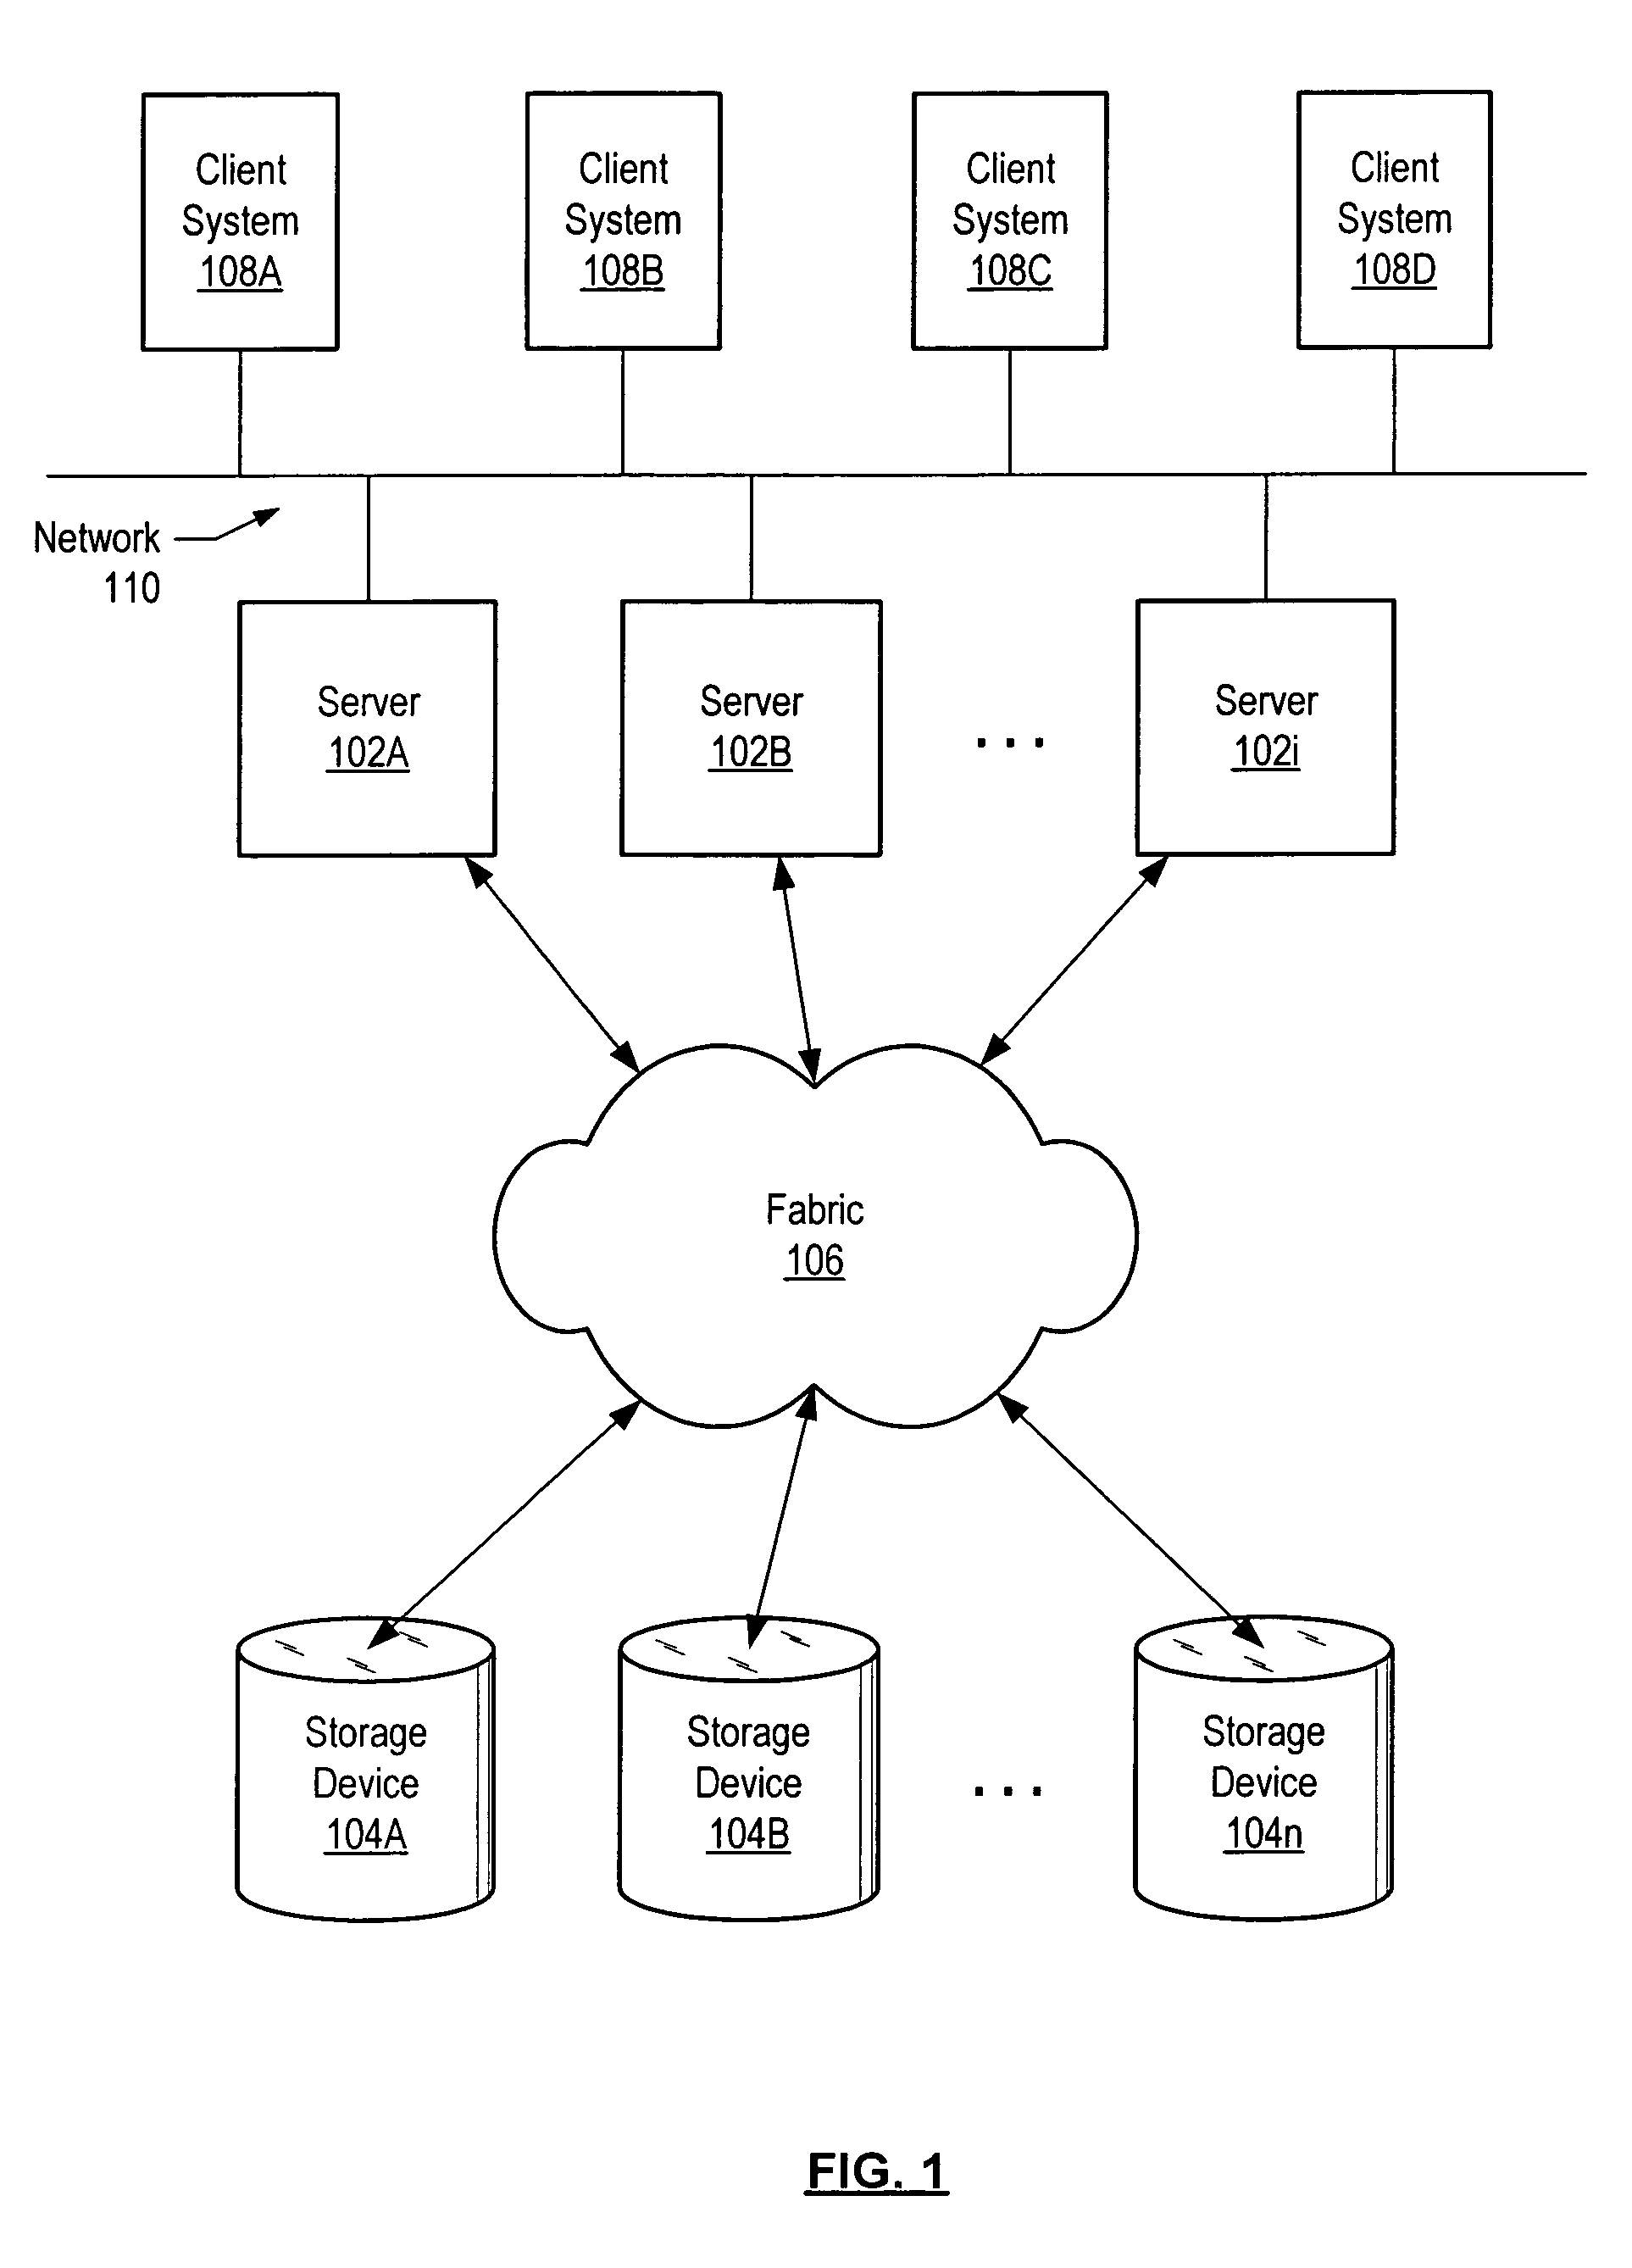
[0023]FIG. 1 illustrates one embodiment of a computer system. In the illustrated embodiment, a storage area network (SAN) environment is formed by one or more host systems or servers 102 (e.g., servers 102A, 102B and 102i) that are interconnected with one or more associated storage devices 104 (e.g., storage devices 104A, 104B . . . 104×) through an interconnect fabric 106. One or more client systems 108A-108D may access the SAN by accessing one or more of the servers 102 via a network 110. Network 110 may include wired or wireless communication mechanisms such as, for example, Ethernet, LAN (Local Area Network), WAN (Wide Area Network), or modem, among others. Note that throughout this disclosure, drawing features identified by the same reference number followed by a letter (e.g., servers 102A-102i) may be collectively referred to by that reference number alone (e.g., servers 102).

[0024]Each of the storage devices 104 may include any of one or more types of storage devices includin...


PUM


Abstract

A system and method for visually depicting component states in a computing system. A graphical analysis tool includes a graphical user interface for use in viewing the history of a selected component. A user selects a system component for viewing and then using a timeline “drags” the state of the selected component to various points on the timeline in order to view states of the component at the selected point in time. States of the selected component may also be played forward or backward in a continuous manner. Logging agents in the system are configured to log data corresponding to detected events and forward the log data to a central repository. The analysis tool may access the data in the repository for use in creating visual displays. Point-in-time snapshots of a component may also be stored in the central repository and used to reproduce the history.

Description

BACKGROUND[0001]1. Field of the Invention[0002]This invention relates to computing systems and, more particularly, to techniques for analyzing a history of changes in a system.[0003]2. Description of the Related Art[0004]In recent years, organizations have become increasingly dependent upon the proper operation of both computer hardware and software. Many business organizations and governmental entities rely upon applications that access large amounts of data, often exceeding a terabyte or more of data, for mission-critical applications. Many of these applications require near-continuous access to data. For example, many systems such as retail processing databases, airline reservation databases, and financial institution databases must be available to perform transaction processing 24 hours a day. Downtime associated with such systems can be disastrous. Accordingly, maintaining the proper operation and availability of the system and its applications is critically important.[0005]In ...

Claims


Application Information

Patent Timeline
IPC IPC(8): G06F15/173
CPCG06F11/324
Inventor DEOLASEE, PAVANVAIDYA, SACHINDIGHE, BHARATBHATT, VANITATHAKUR, PARAGXU, MING
Owner SYMANTEC OPERATING CORP
Why Eureka
Try Eureka