System and method for prioritization and display of aggregated data

a technology of aggregated data and system and method, applied in the field of system and method for the presentation and display of information, can solve the problems of inability to provide numerical measurements to professionals, inability to absorb and contextualize human beings, and inability to meet the needs of professional users, etc., to achieve the effect of facilitating visual recognition

Active Publication Date: 2013-07-16
FORD JOHN P
View PDF56 Cites 2 Cited by
  • Summary
  • Abstract
  • Description
  • Claims
  • Application Information

AI Technical Summary

Benefits of technology

[0011]The disclosed system and method for data aggregation and prioritization of the present invention includes the use of a computer for aggregating data describing a subject, such as the health condition of a patient, and then divides the data describing the subject into a predetermined group of categories. The aggregated data is then graphically displayed initially at a predetermined position on a geometric figure, such as a predetermined coordinate point or range of points on the circumference or circle. Thus, a certain category of data will always appear at the same point or range of points. This positioning facilitates visual recognition by a user. Specifically, if a user wants to observe a certain category of data he knows exactly where to find the desired data. More particularly, all data categories have a distinct graphic address on a macro data array such as coordinate on a circulator array much like the directional positions on a compass. Distortions and anomalies in the data are graphically shown in an easy-to-read figure as variations from a norm or a data anomaly.

Problems solved by technology

Just a few years ago, many of the numerical measurements now provided to professionals were unavailable.
An unfortunate consequence of making large amounts of information available to professionals is that the finite capacity of human beings to absorb and to contextualize may be exceeded.
When the finite capacity of a human being to absorb and contextualize information is exceeded there may be several adverse consequences.
For example, important data may become buried in unimportant data.
Despite the effort spent reviewing each chart to look for variances from a norm or to spot trends, the complex nature of a medical chart and physician (user) fatigue may cause key information, such as a variance from a norm or a data anomaly, to be missed.
The consequences of missing key items of data, particularly in a health care situation, can be extremely dangerous or even fatal.

Method used


Image

  • System and method for prioritization and display of aggregated data
  • System and method for prioritization and display of aggregated data
  • System and method for prioritization and display of aggregated data

Examples


Embodiment Construction

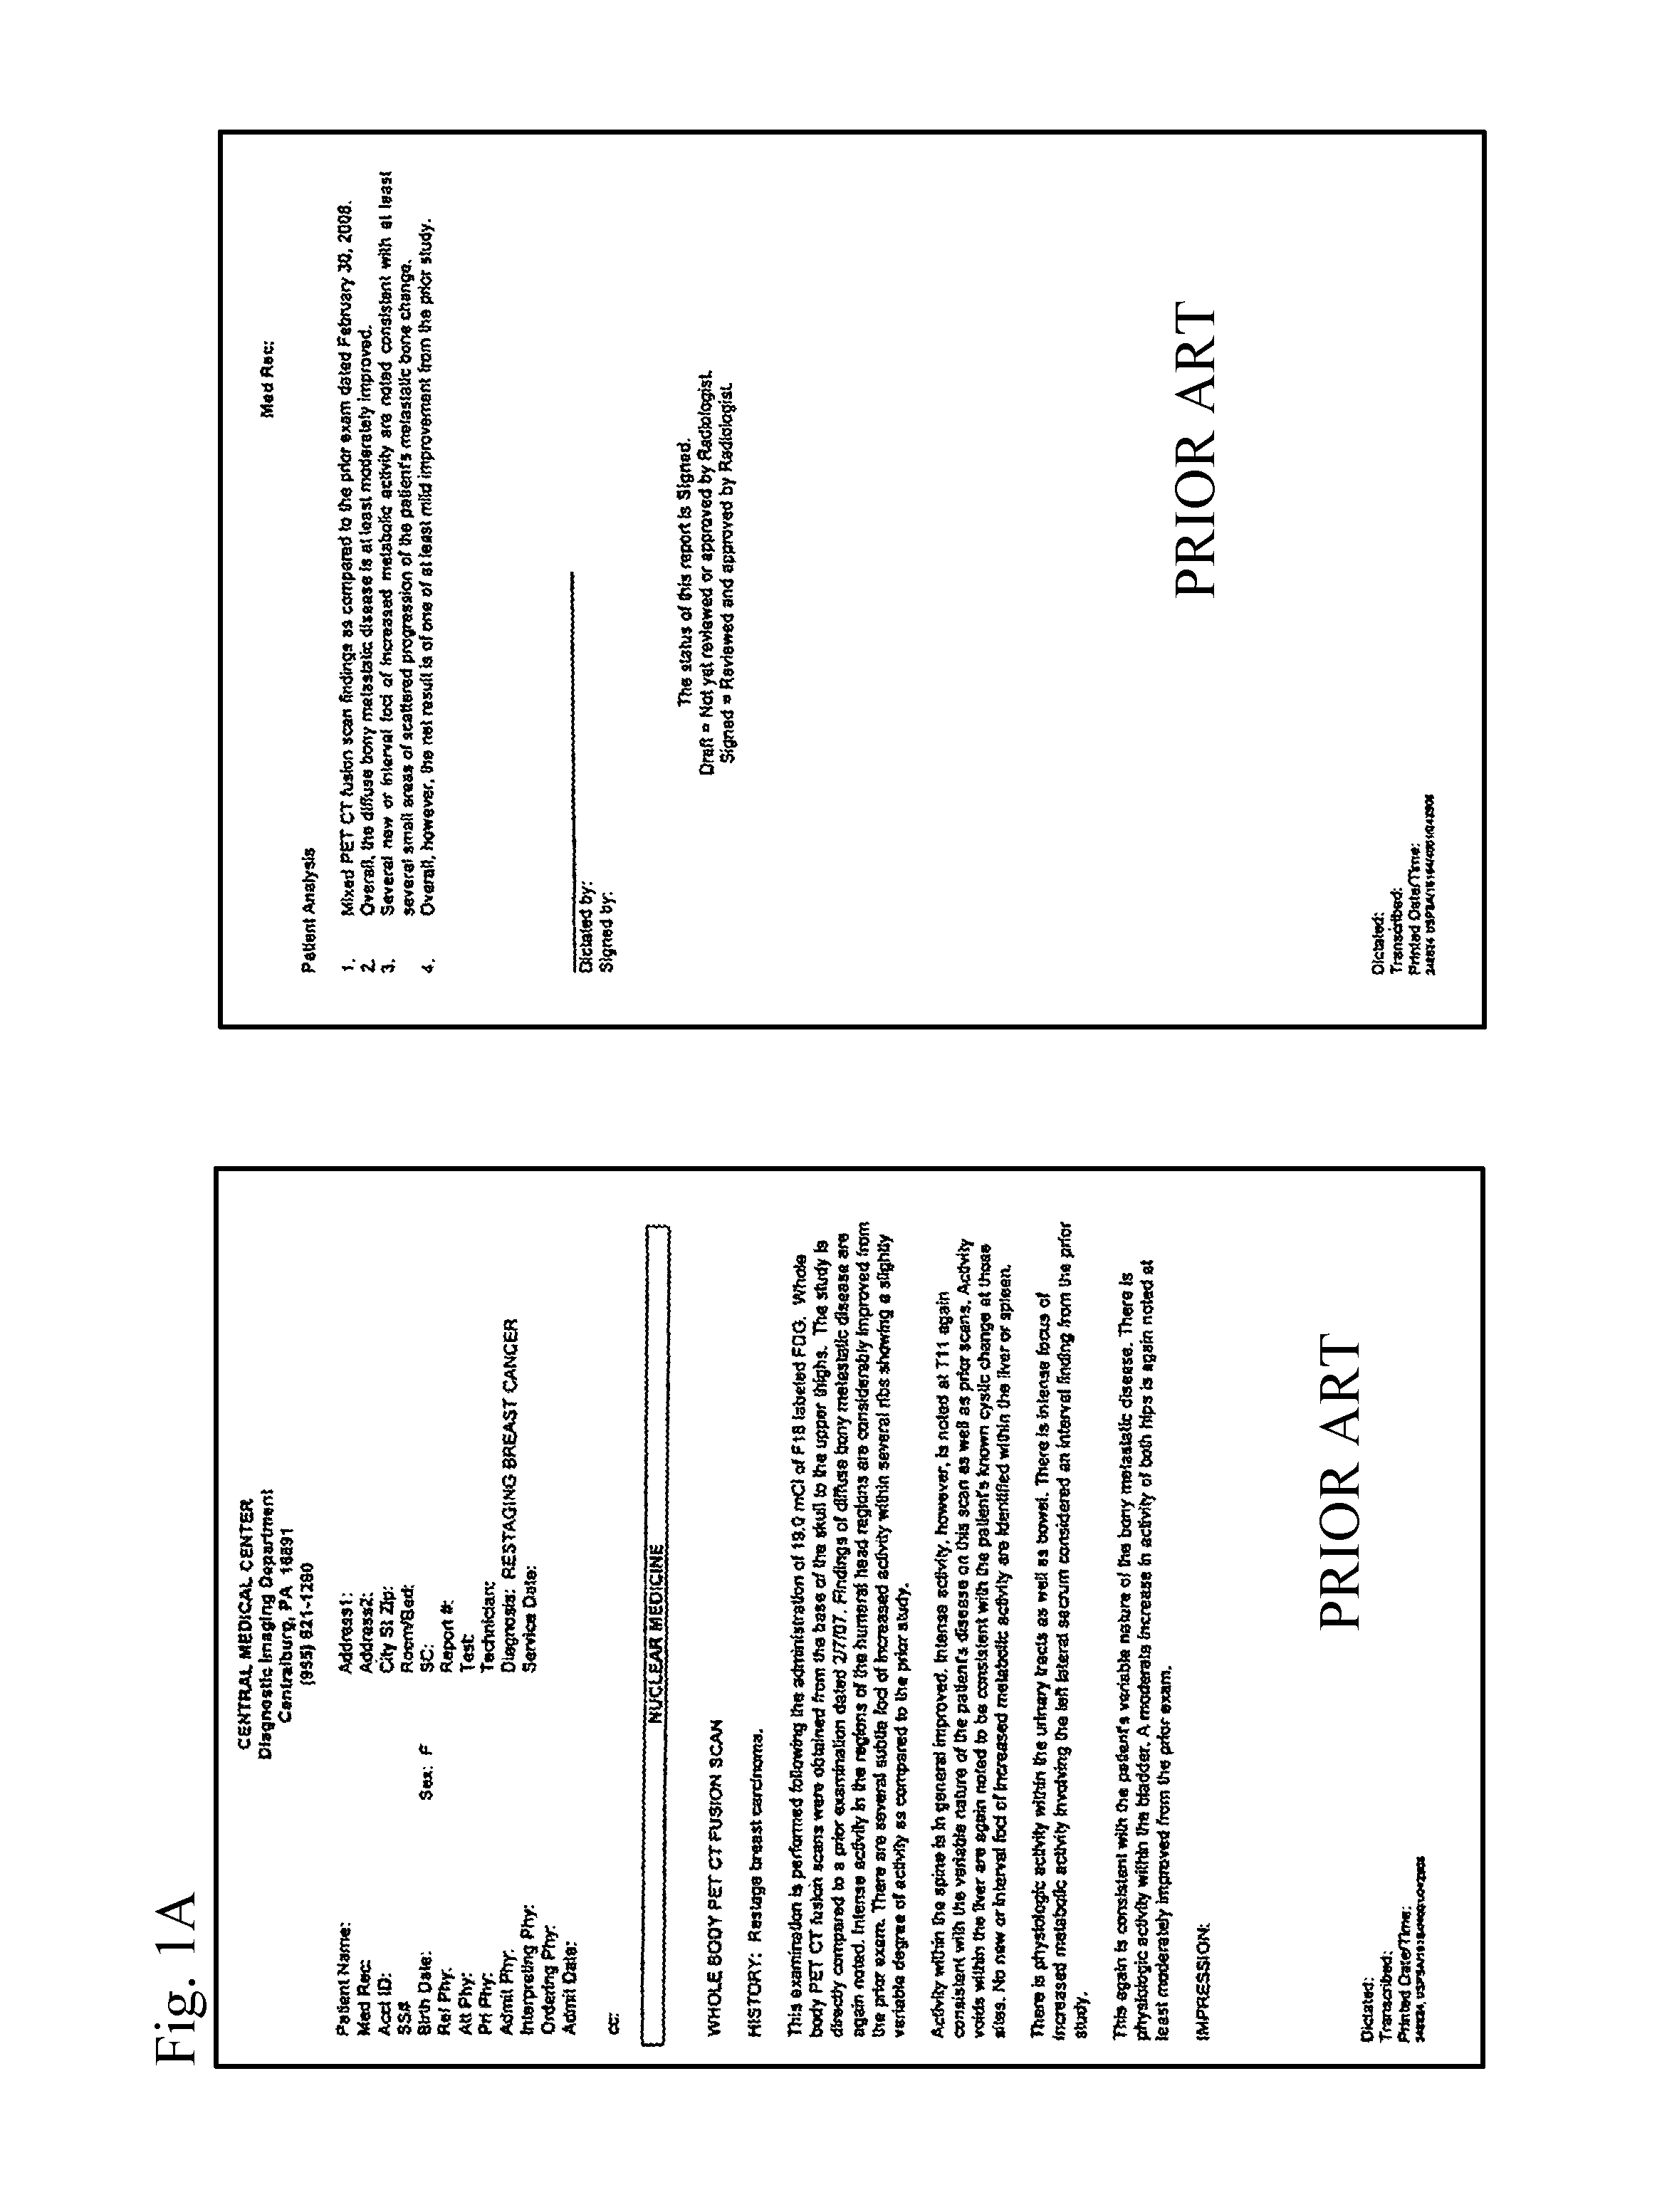
[0023]As explained in the BACKGROUND and SUMMARY portions above, professionals in numerous fields are provided with multiple reports including data reporting measurements or test results including numerous parameters. The data in the reports may be used to represent the condition of a particular parameter along with a history of the work done or interventions made by others. The professional evaluating the reports is then expected to use professional judgment to determine if the data warrants intervention or if a future course of action is necessary before an intervention is made.

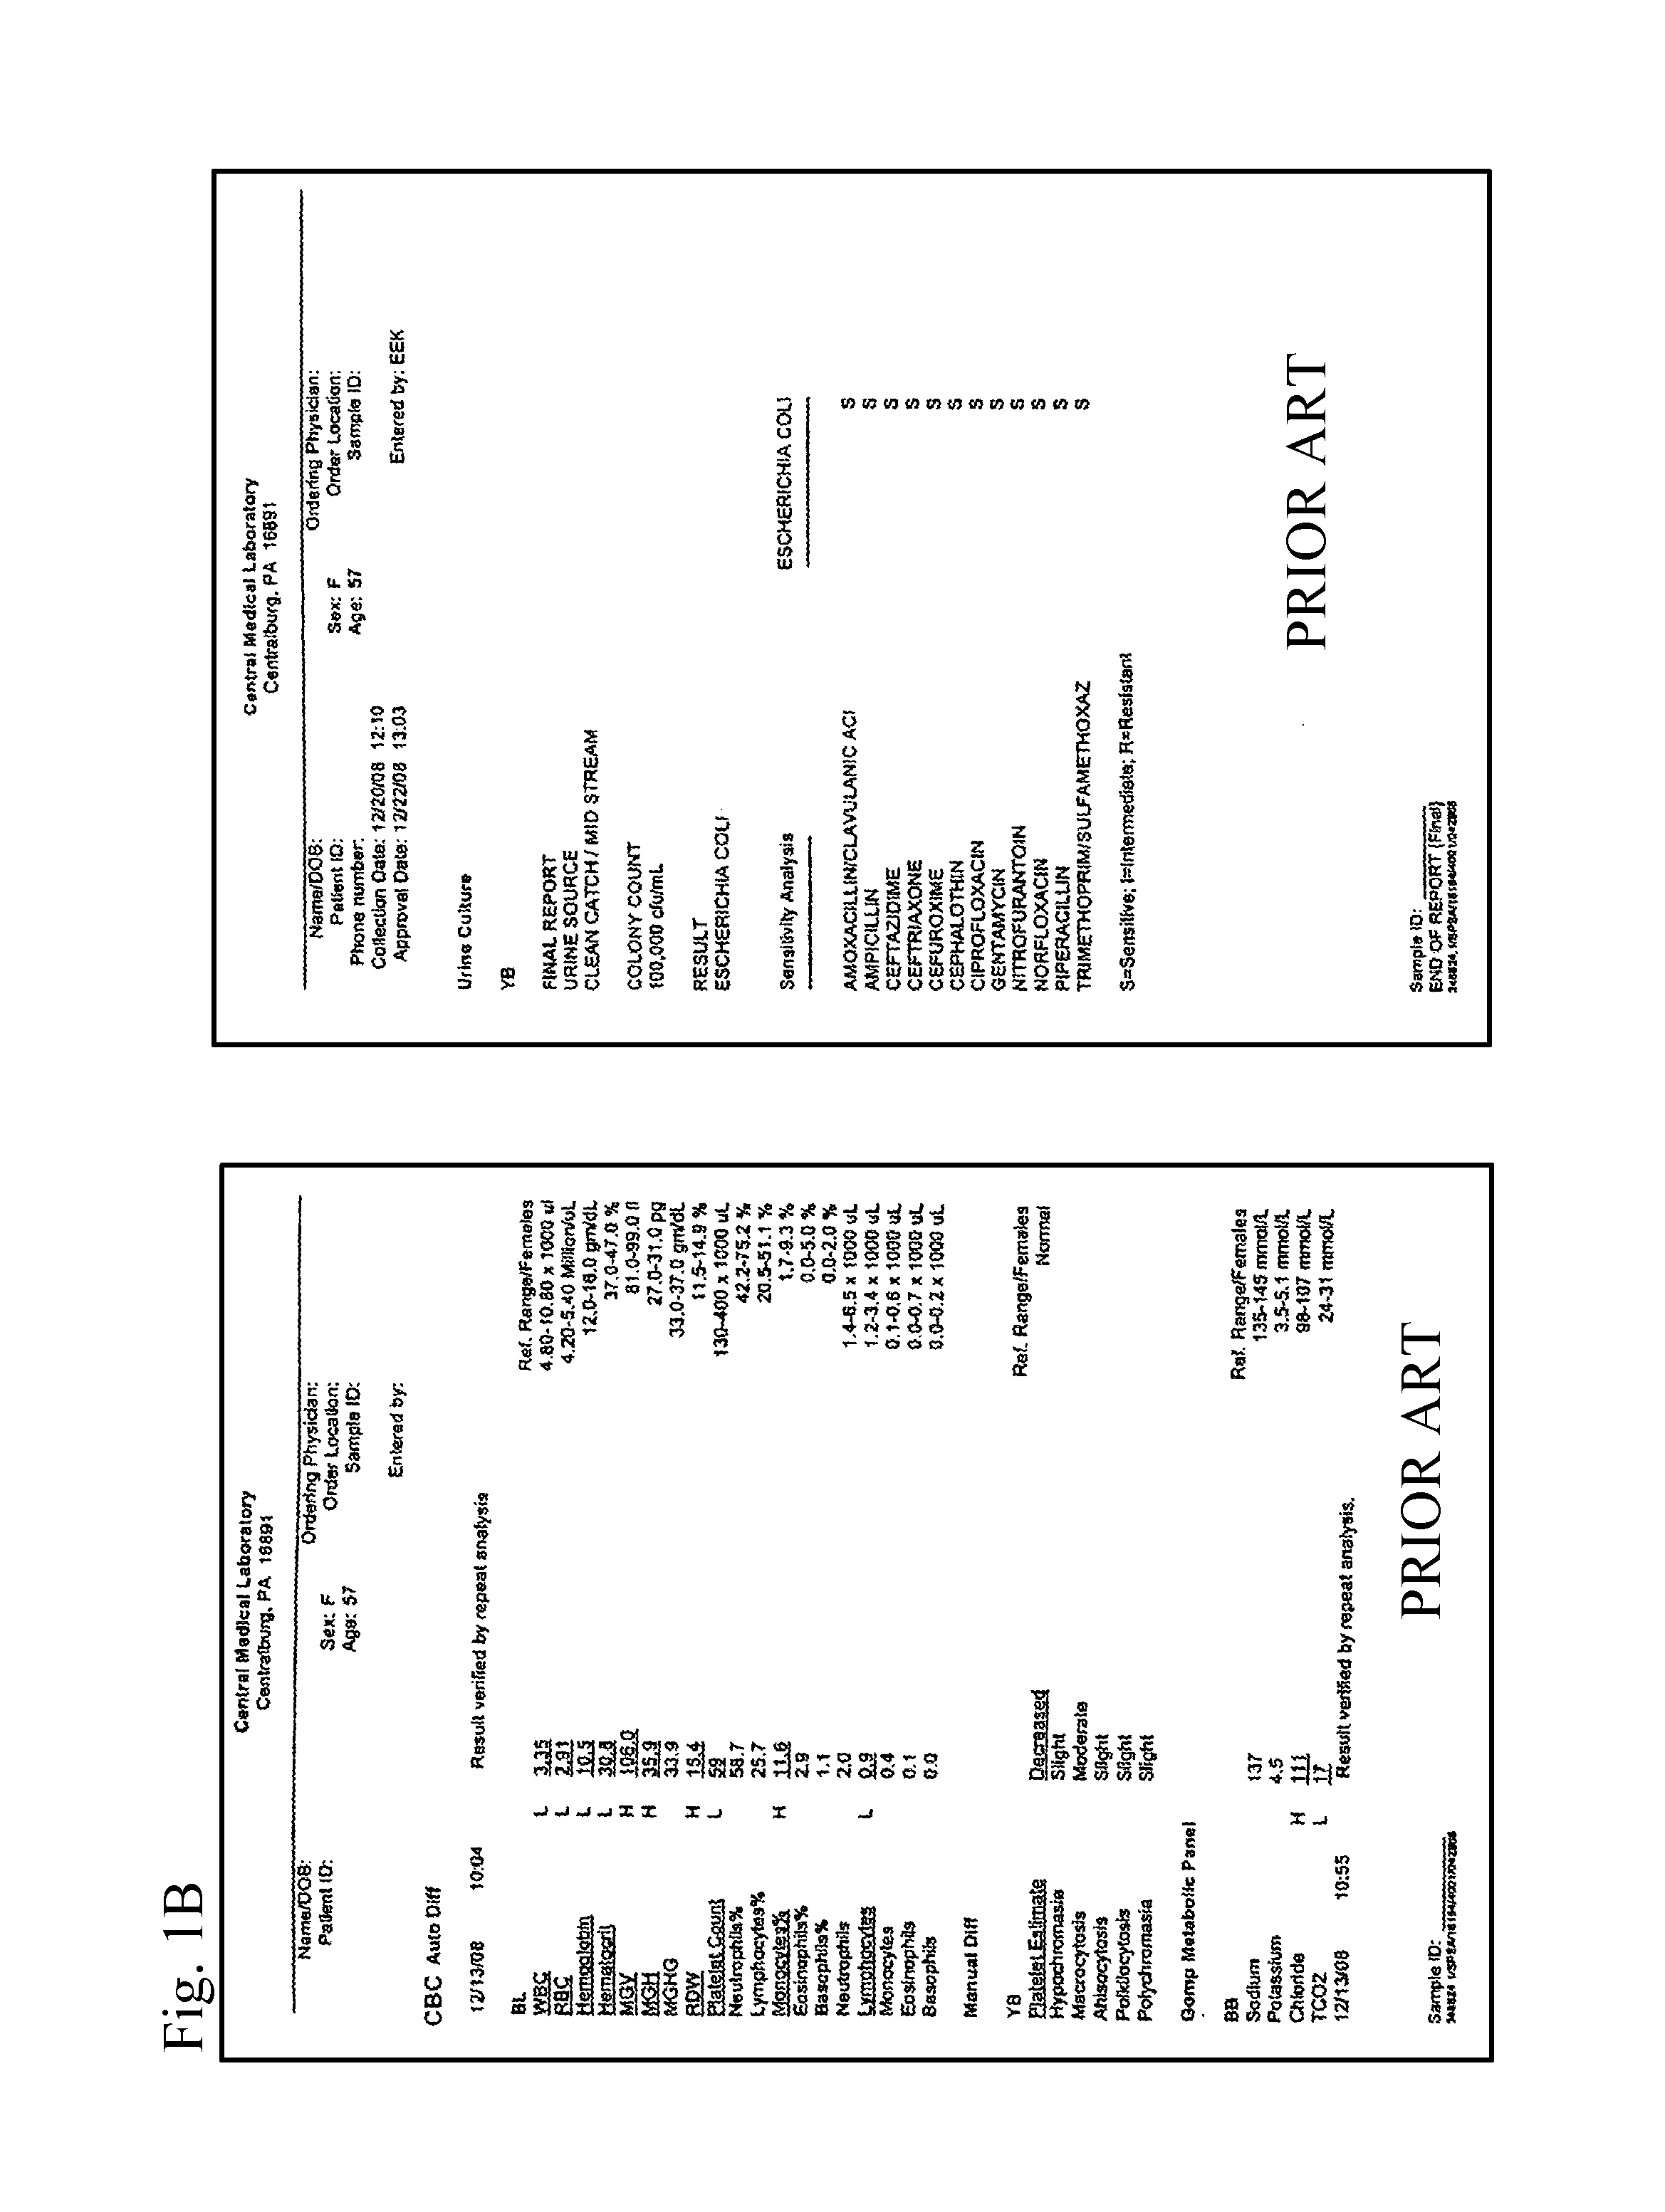
[0024]In most cases, the judgment of a professional is needed because the data reporting measurements or test results including of one or more parameters show what may be called baseline data and other data that may be called intervention data. Baseline data typically expresses or confirms test results within a normal or anticipated range of values. Intervention data is that data which shows a deviation of ...


PUM


Abstract

A computer enabled system and method aggregates data describing a particular subject. The data is then divided into a predetermined group of categories which are graphically displayed according to a predetermined pattern. Distortions in the data or anomalies in the data are made visually apparent. Associated with the display is a prioritized array of interventions recommended in response to the distortions in the data or anomalies appearing in the data.

Description

CROSS REFERENCE TO RELATED APPLICATION[0001]This application claims the benefit of Provisional U.S. Patent Application No. 60 / 933,038 filed Jun. 4, 2007.STATEMENT REGARDING FEDERALLY FUNDED RESEARCH AND DEVELOPMENT[0002]The invention described in this patent application was not the subject of federally sponsored research or development.FIELD[0003]The present invention relates to a system and method for the presentation and display of information; more particularly, the present invention relates to a computer implemented system and method which aggregates and prioritizes data relating to a particular subject to enable an observer to both identify and understand deviations or anomalies of data with respect to a predetermined base line or norm by a visual presentation of the data.BACKGROUND[0004]In the past twenty years there has been an explosion in the amount of information made available to professionals in all fields. The reasons for this explosion in the amount of information made...

Claims


Application Information

Patent Timeline
Patent Type & Authority Patents(United States)
IPC IPC(8): G06F17/30
CPCG06F19/3487G16H15/00
Inventor FORD, JOHN P.
Owner FORD JOHN P
Why Eureka
Try Eureka