Apparatus and method for locating the centre of a beam profile

a beam profile and applicator technology, applied in the field of applicator and method for locating can solve the problems of large cost and complexity of a bpr or bpe system, interference fringe pattern contamination by a large amount of so-called ‘speckle’ noise, and achieve accurate positioning of the centre of a beam profile. , the effect of removing speckle interferen

Inactive Publication Date: 2015-07-28
MORRIS STEPHEN J DR
View PDF26 Cites 0 Cited by
  • Summary
  • Abstract
  • Description
  • Claims
  • Application Information

AI Technical Summary

Benefits of technology

[0018]optimising the location of the centre of at least one of the one or more strips so as to obtain the best fit between the average intensity plot and the actual intensity plot to thereby identify the centre of the beam profile.
[0019]Embodiments of the invention effectively provide a method which can be used to accurately locate the centre of a beam profile even when the profile is asymmetrical. This information may be used to determine the orientation of the sample generating the beam profile. Conveniently, embodiments of the present invention can help to smooth out a noisy beam profile, for example, to remove speckle interference. In addition, the present invention can determine the centre of a beam profile for a sample having unknown physical characteristics (for example, an unknown surface structure or coating), because the method does not, at any point, require any assumptions about the sample or the surface reflectance itself.
[0036]In particular embodiments, the ray-tracing technique may comprise one or more of the features described in the Applicants co-pending UK patent application, Attorney file reference PB141826GB. As explained in that patent application, using ‘time reversal’ in the ray-tracing technique is advantageous in that it can substantially reduce the size of the calculation that must be carried out and therefore it can be used to simplify and accelerate the procedure. The reason that this approach can substantially reduce the size of the calculation will become apparent from consideration of the following. It will be understood that parameters describing the orientation of a sample are continuous in nature (i.e. the surface of the sample is continuous so light can reflect from it at any location) but the light-sensitive elements of a physical detector are discrete (i.e. the detector is composed of a plurality of individual detector elements or pixels). If a ray is considered to start from a certain location (x, y) within a source beam and is followed through an optical system to a detector at a location (x′, y′), it may reach the detector at a position close to an individual detector element's centre, at its edge or even between elements. In order to calculate correctly the final intensity value recorded by the detector element at (or closest to) (x′, y′), it is necessary to know not only the amplitude and phase of the light ray that originated at (x, y) but also the amplitude and phase of all the other rays from the source beam that eventually arrive at the same detector element. When the rays themselves are of course not discrete but form part of a continuous light beam, this becomes a complicated calculation, involving a time-consuming interpolation step similar to that described in another of the Applicant's earlier patent applications, published as WO2008 / 119984. It is therefore possible to reduce the size of the calculation by starting the ray-tracing technique from the detector (in particular, from an individual detector pixel) since only those rays that will influence the detector response need be considered.
[0062]It will be understood that because the method makes no assumptions about the nature of the sample, it has applications much wider than just making coating thickness measurements using BPR or BPE. On the contrary, the present method can be used to measure the orientation of any sample (i.e. any tilted reflective surface), likewise, the present method can be carried out without utilising any information about the amplitude distribution of the source. However, if such information is available and is used to divide both intensity plots (i.e. that obtained from averaging over the labelled regions, and that obtained from a simple cross-section along the centre of the strip), then when the correct alignment is obtained both these plots will be symmetrical, whereas away from alignment they are asymmetrical, which further enhances the sensitivity of the technique to find the true centre.
[0063]The method can be carried out using a single such strip, but using more than one strip (in the preferred embodiment, two) further enhances the sensitivity.

Problems solved by technology

However, the requirement for this alignment (whether achieved statically for flat samples by very accurate construction of supporting hardware, or dynamically for curved surfaces using a stage such as that referred to above) introduces significant cost and complexity into a BPR or BPE system.
In that application, however, no quantitative estimate of the amount of misalignment was made, it being sufficient to know in which direction a motorised axis needed to be moved while an optical feedback loop was provided to monitor the changing alignment state.
In addition to the effect of misalignment in the sample's orientation, where the measured data is collected using a coherent laser beam as the light source, the interference fringe pattern is typically contaminated by a large amount of so-called ‘speckle’ noise caused by interference between specularly-reflected light from the sample and scattered light from surface defects and / or dust particles on the system's optical components.
The Applicants have found that, despite the existence of many algorithms for filtering noisy data and locating the centre of an interference pattern, none of them have proved suitable for the peculiar characteristics of BPR and BPE fringe patterns where (a) the fringe spacing is not regular but becomes much ‘denser’ as one goes from the centre to edge of the pattern, with the rate-of-change depending on the sample refractive index which is not known beforehand, and (b) misaligned fringe patterns do not consist of perfect concentric circles but of ‘distorted’ circles which are also unevenly illuminated.

Method used


Image

  • Apparatus and method for locating the centre of a beam profile
  • Apparatus and method for locating the centre of a beam profile
  • Apparatus and method for locating the centre of a beam profile

Examples


Embodiment Construction

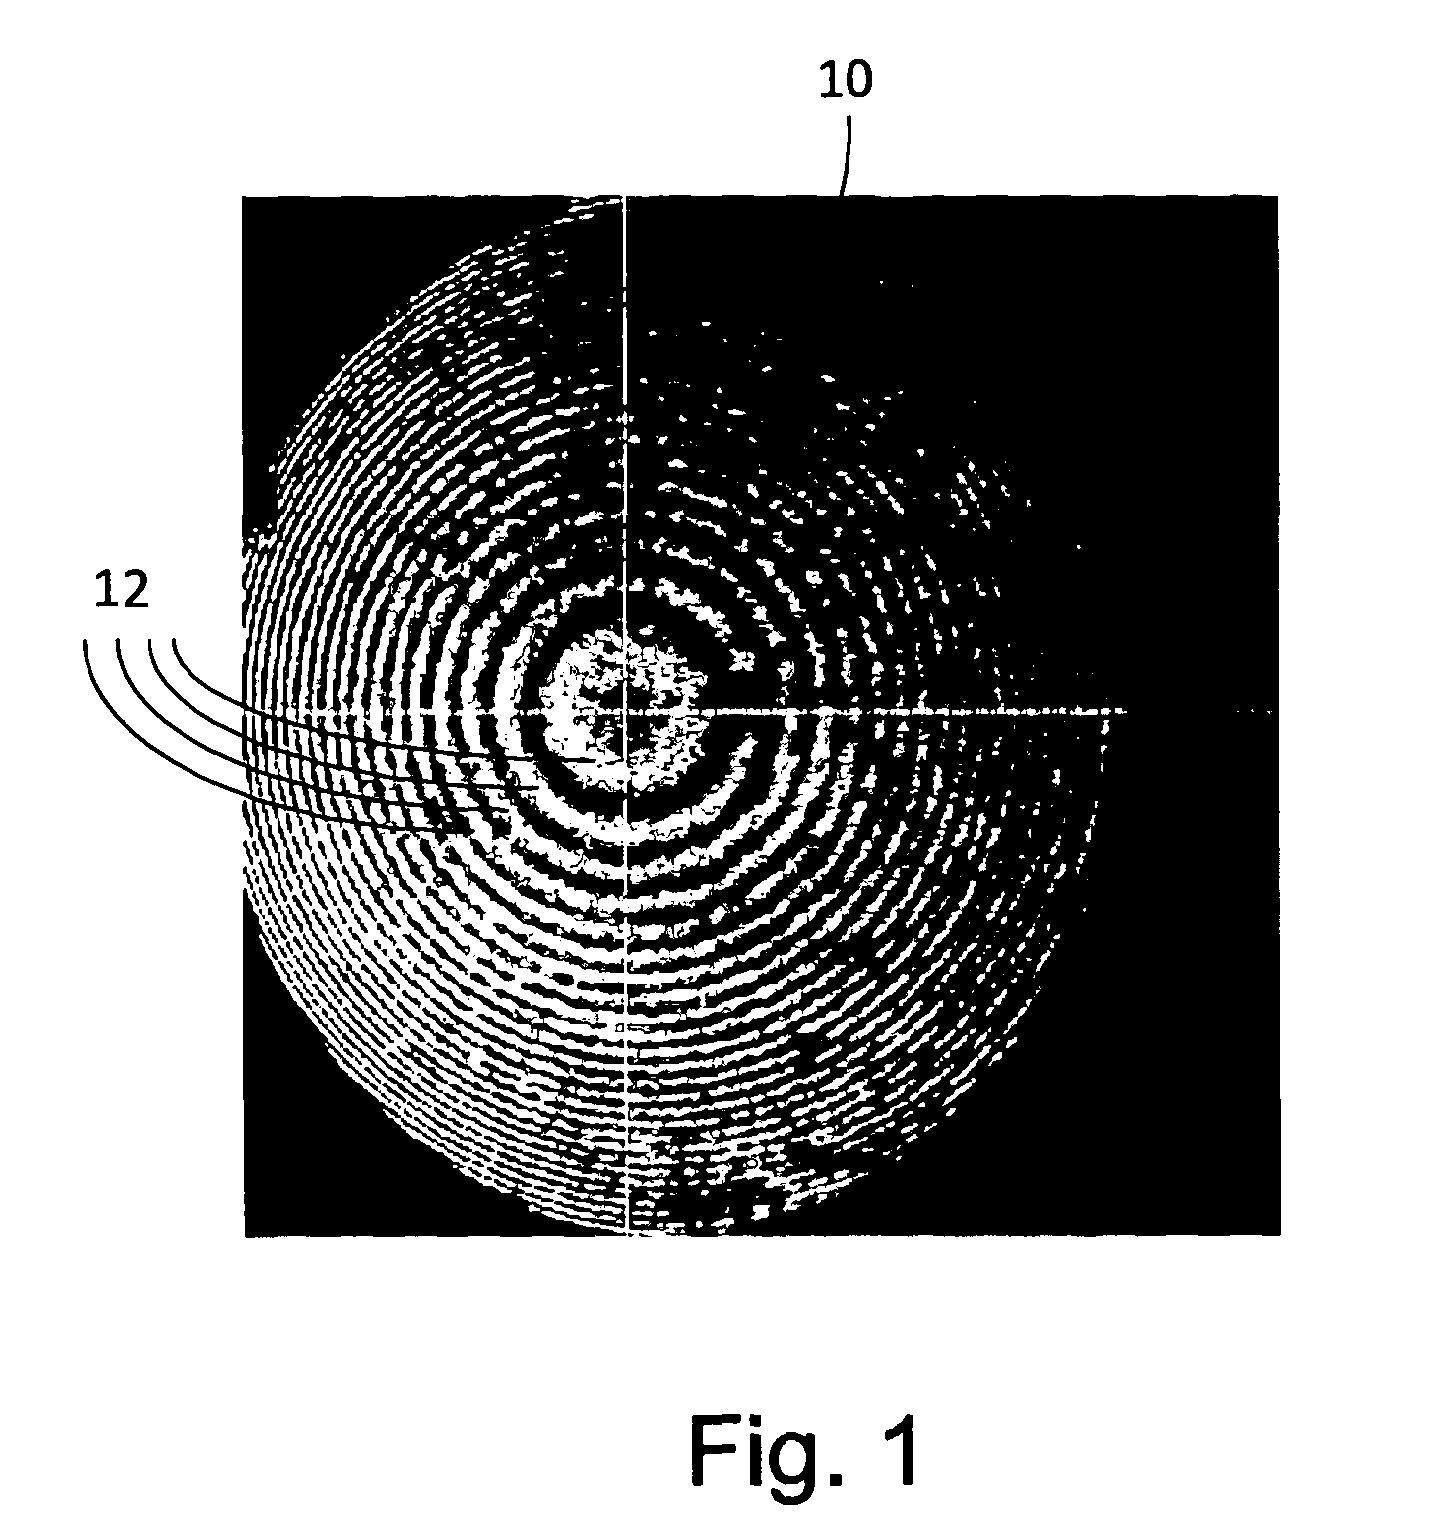
[0081]As explained above, FIG. 1 shows a typical BPR beam profile in the form of an interference pattern 10 having multiple, generally concentric ring fringes 12, taken from a sample which was misaligned with respect to the focal plane of the optical apparatus that generated the beam profile. Due to a combination of the speckle noise in the interference pattern 10 and the fact that the fringes 12 are closer together at the left-hand side of the image than they are at the right-hand side of the image, it is not possible to accurately determine where the centre of the beam profile is using standard techniques. However, as will be described in detail below, the location of the centre of the beam profile can be accurately determined using embodiments of the present invention.

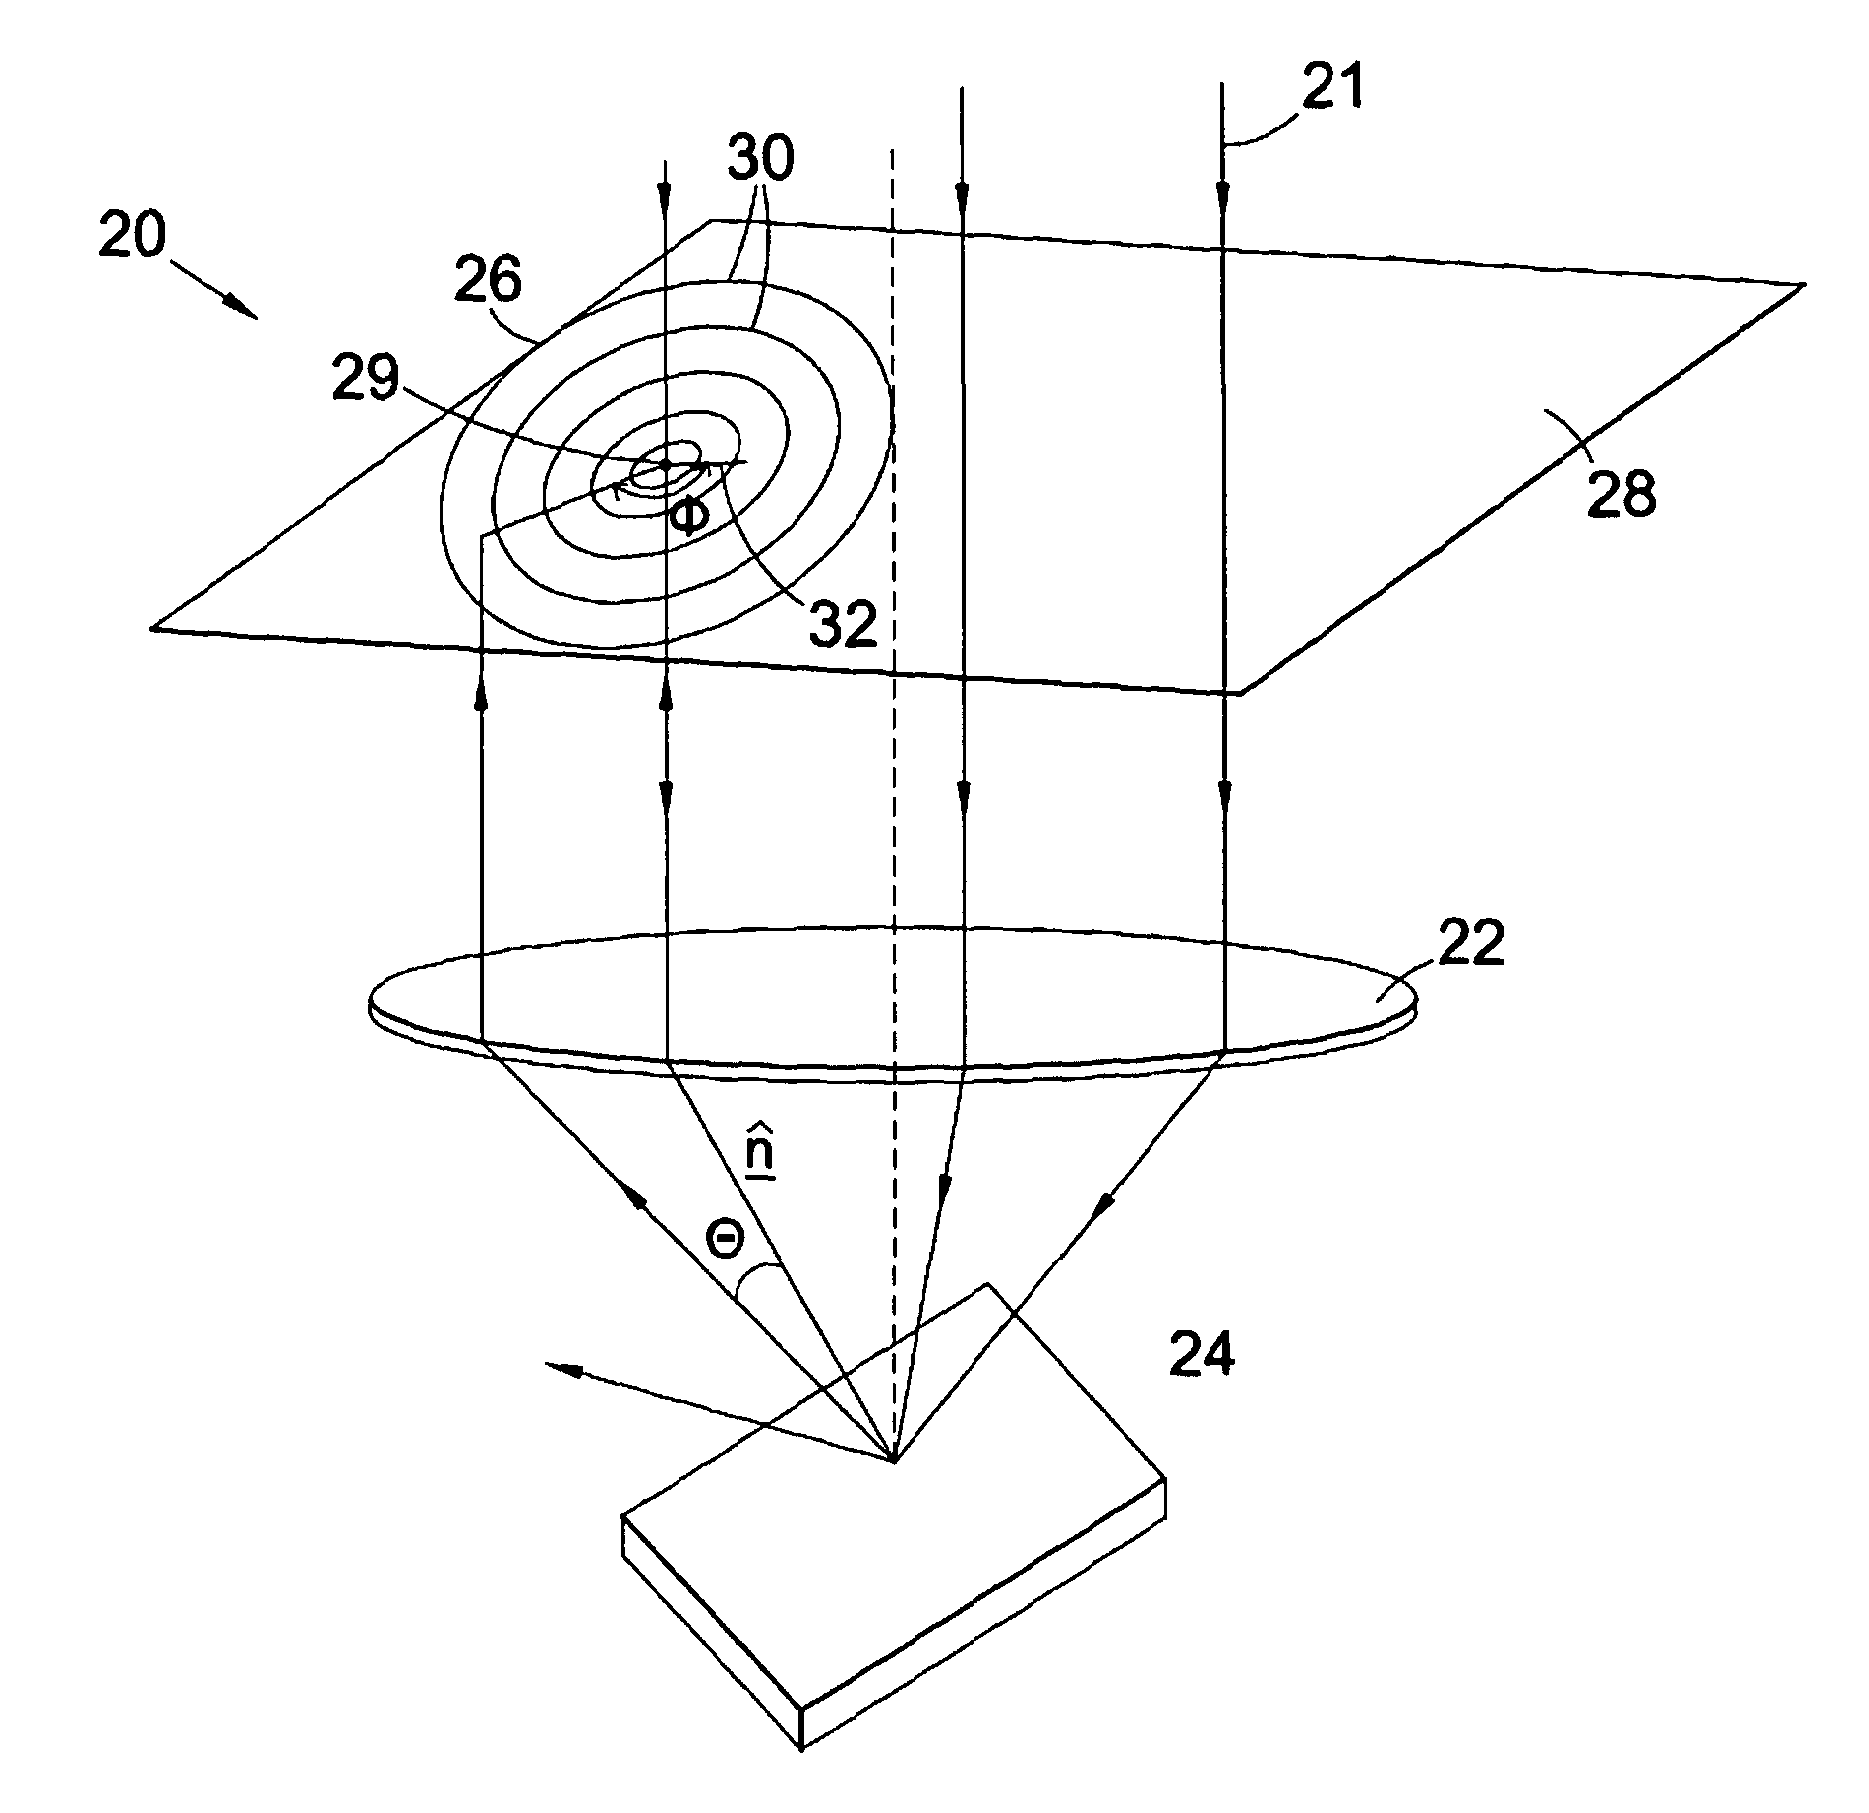
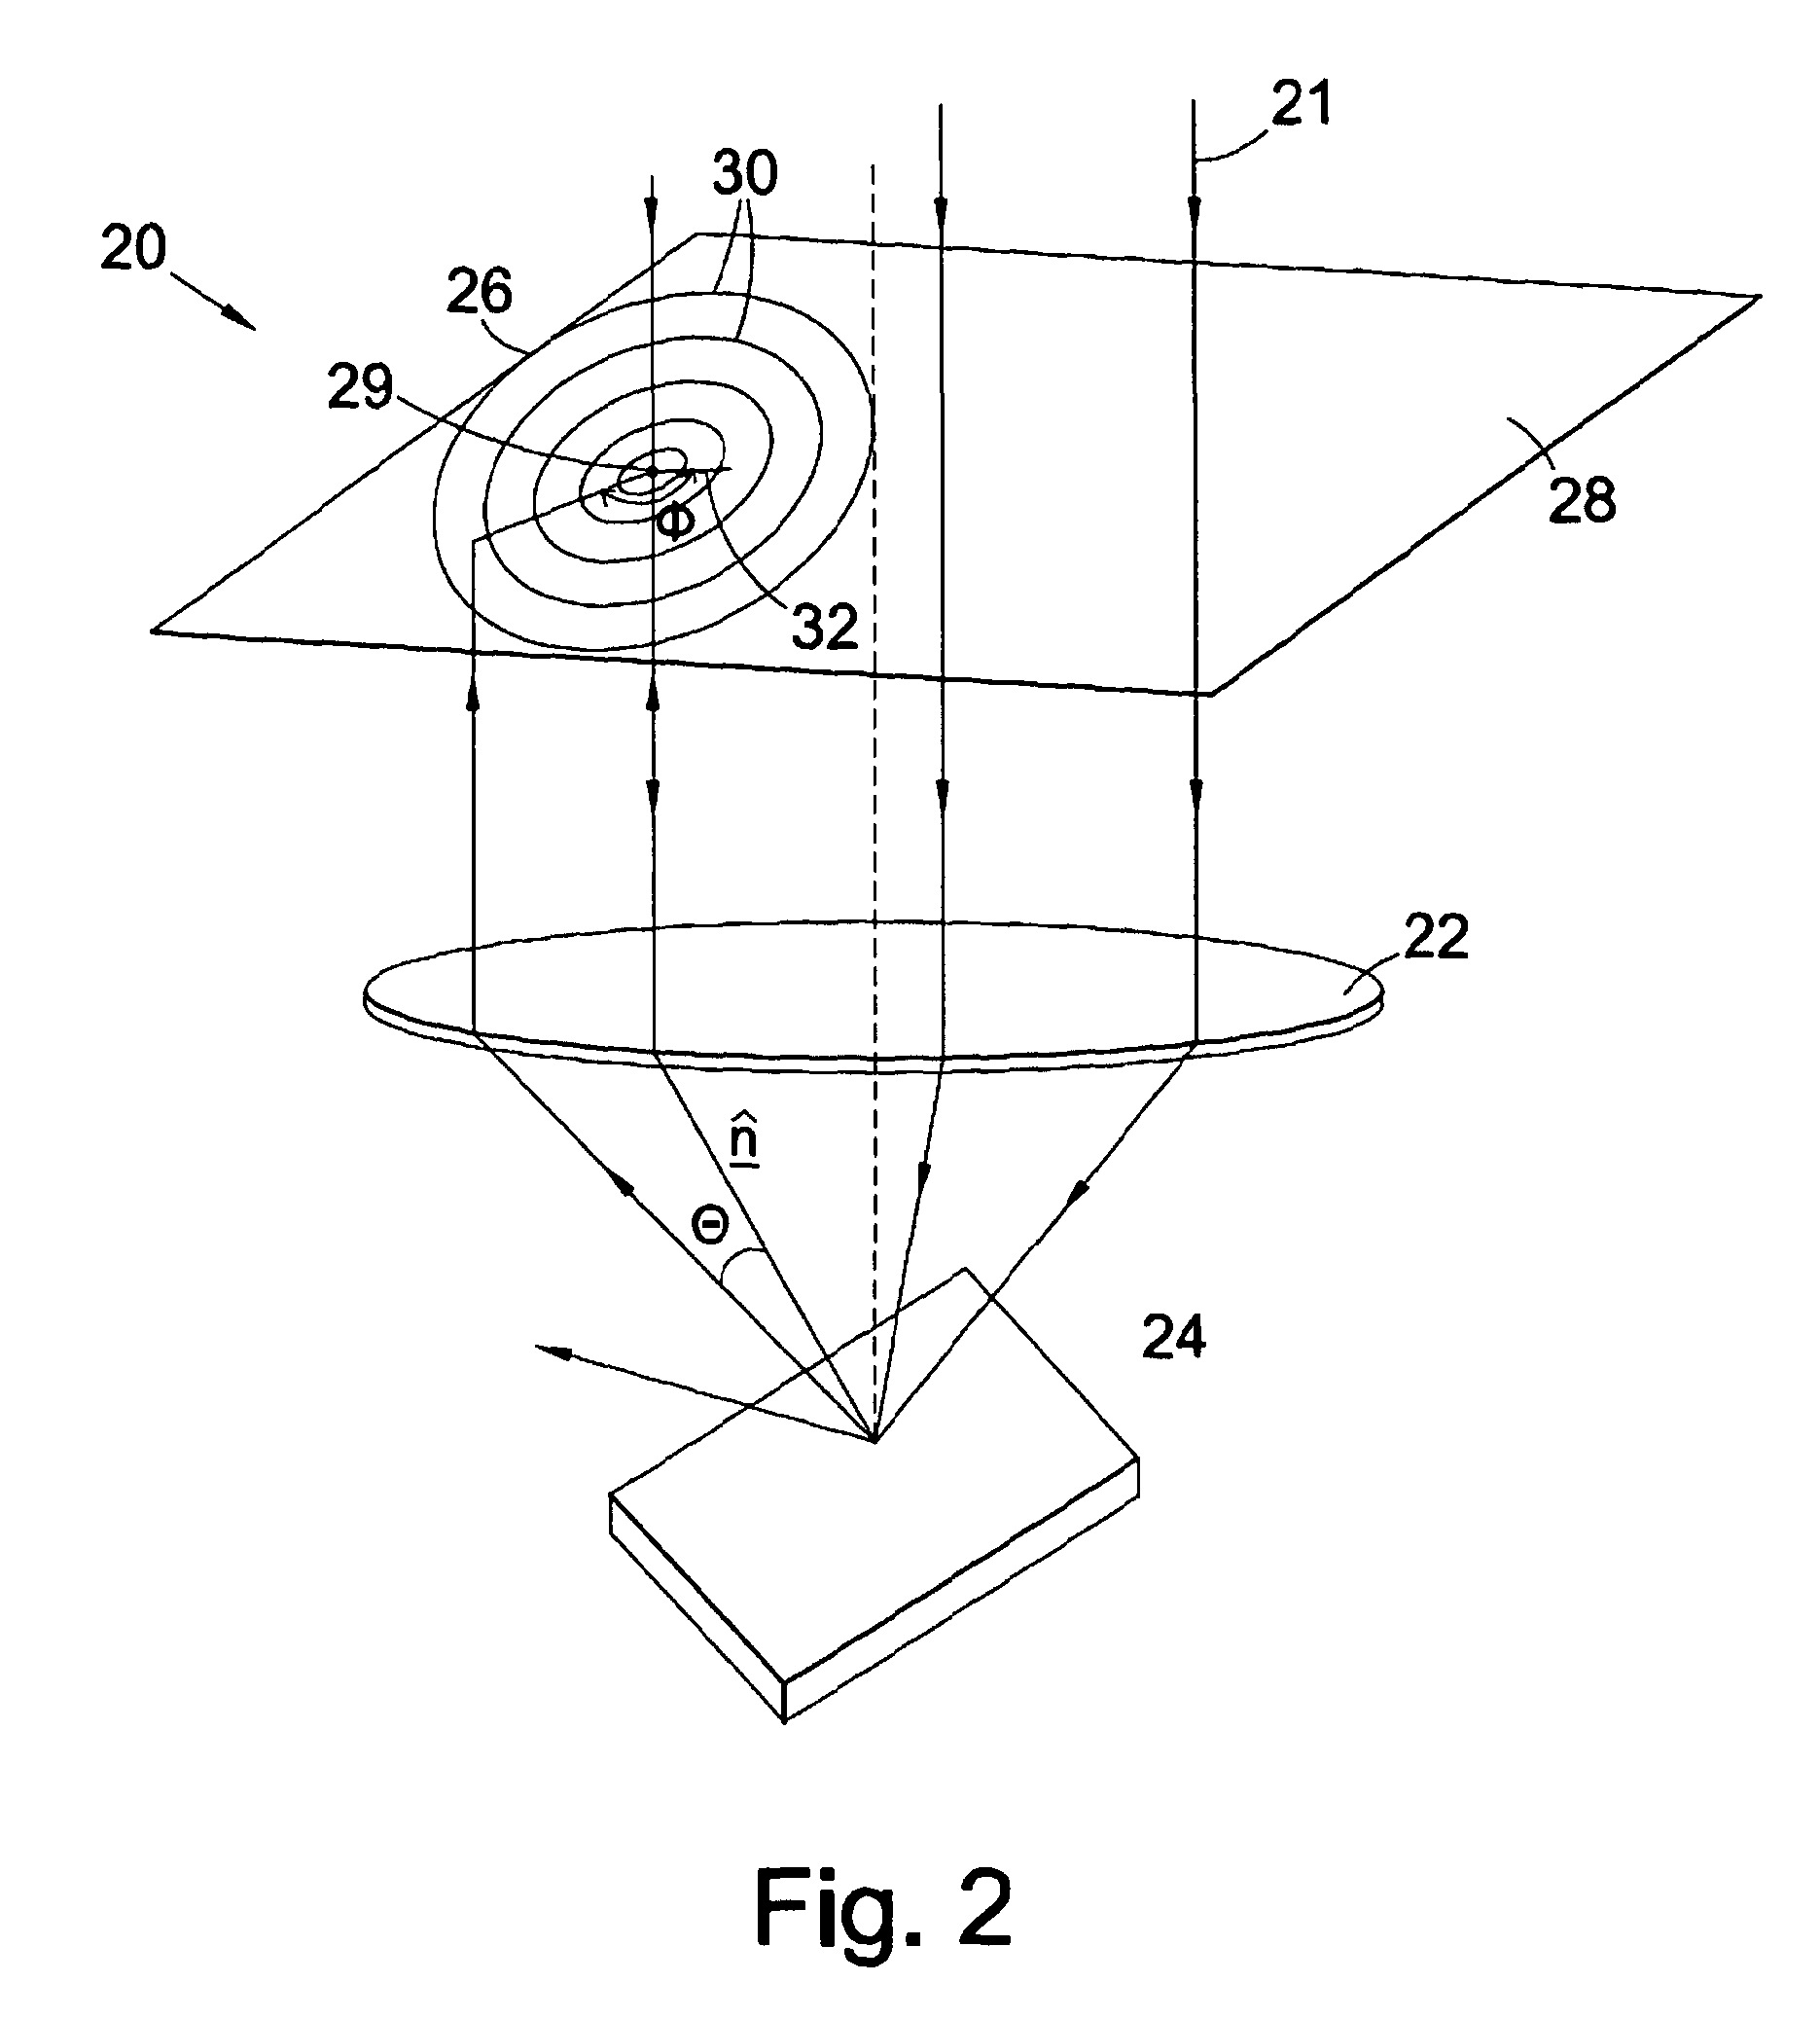
[0082]FIG. 2 shows a method and apparatus according to a first embodiment of the present invention. More specifically, FIG. 2 shows a portion of a BPR measurement system 20 in which light rays 21 from a laser source...


PUM

PropertyMeasurementUnit
reflectanceaaaaaaaaaa
angleaaaaaaaaaa
angleaaaaaaaaaa

Abstract

A method for locating the center of a beam profile, comprises the steps of: providing a beam profile; selecting one or more strips through the beam profile; identifying distinct regions of intensity along the one or more strips and labelling them consistently; calculating a combined average intensity for each labelled region, using data from the one or more strips; plotting the average intensity against the labelled regions and comparing the results with a plot of the actual intensity obtained by taking a cross-section through the center of at least one of the one or more strips; and optimizing the location of the center of at least one of the one or more strips so as to obtain the best fit between the average intensity plot and the actual intensity plot to thereby identify the center of the beam profile.

Description

CROSS-REFERENCE TO RELATED APPLICATIONS[0001]This application is a U.S. National Phase Application of PCT / GB2011 / 000806, filed May 26, 2011, which claims priority to and the benefit of United Kingdom Patent Application No. 1009040.5, filed May 28, 2010. The entire disclosure of each of these applications is incorporated by reference herein.FIELD OF THE INVENTION[0002]This invention relates to an apparatus and method for locating the centre of a beam profile. Furthermore, the invention relates to an apparatus and method for determining the orientation of a sample in an optical measurement apparatus, by location of the centre of a beam profile.BACKGROUND TO THE INVENTION[0003]Beam Profile Reflectometry (BPR) and Beam Profile Ellipsometry (BPE), described in U.S. Pat. Nos. 4,999,014 and 5,042,951 respectively, are established methods for measuring the thicknesses of thin films and coatings deposited upon flat substrates. Each of these techniques makes use of data contained in the cross...

Claims


Application Information

Patent Timeline
Patent Type & Authority Patents(United States)
IPC IPC(8): G01J1/02G01J1/42G01N21/21
CPCG01N21/211G01J1/4257
Inventor MORRIS, STEPHEN
Owner MORRIS STEPHEN J DR
Why Eureka
Try Eureka