Reference-based in-band OSNR measurement on polarization-multiplexed signals

a polarization-multiplexed optical and reference-based technology, applied in the direction of electrical equipment, transmission monitoring, electromagnetic transmission, etc., can solve the problems of increasing the difficulty of achieving a reliable measurement of the noise level within the channel bandwidth, severe spectral characteristics requirements, and unreliable interchannel noise level interpolation, etc., to achieve the effect of reducing measurement uncertainties and noise contributions

Active Publication Date: 2015-08-18
EXFO
View PDF51 Cites 8 Cited by
  • Summary
  • Abstract
  • Description
  • Claims
  • Application Information

AI Technical Summary

Benefits of technology

[0013]Knowledge of the spectral shape of the signal contribution may come from the acquisition of an optical spectrum trace of a reference signal taken at a different point, generally upstream, along the same optical communication link (i.e. the reference signal originates from the same optical transmitter), where the OSNR is known or where the signal can be considered free of ASE noise. Considering that, within the optical signal bandwidth, the spectral shape of the signal does not significantly change along the communication link, the signal contribution of such a reference signal is spectrally representative of the signal contribution of the signal-under-test. Of the embodiments described herein, this one which uses a reference signal taken at a different point along the same optical communication link generally minimizes the measurement uncertainties.
[0017]It is noted that the provided method only requires knowledge of the relative distribution of the optical power over the optical signal bandwidth, for both the SUT and the reference signal. No absolute power level value is required. Hence, the optical spectrum trace acquisitions can be made via tap monitoring ports on the optical communication link for example, thus allowing non-intrusive measurement and no service interruption.

Problems solved by technology

Increased modulation rates, which enlarge the signal bandwidth, and increased channel density, reduce the interchannel width; therefore resulting in severe spectral characteristics requirements for the optical spectrum analyzers used to perform the measurement.
The interpolation of the interchannel noise level then becomes unreliable.
However, increased modulation rates combined with narrow filtering of multiplexers and demultiplexers is making it increasingly difficult to achieve a reliable measurement of the noise level within the channel bandwidth.
However, such methods are based on the assumption that the signal is generally highly polarized, an assumption that is not valid in the case of polarization-multiplexed signals.
For the case of most polarization-multiplexed signals, the “signal”, as detected on a photodiode having low bandwidth electronics for instance, appears unpolarized, and hence, these above-mentioned in-band OSNR measurement methods cannot be used to reliably provide the OSNR measurement.
A first limitation of this method is that it requires making certain assumptions about the noise variations that occur upon turning off the signal for which the OSNR needs to be measured.
In cases where the measurement is to be carried out on a system that is in operation, such a method involving turning off the signal has the important practical limitation that it implies a service interruption for the channel of interest and possible disruption of the other channels on the system.

Method used


Image

  • Reference-based in-band OSNR measurement on polarization-multiplexed signals
  • Reference-based in-band OSNR measurement on polarization-multiplexed signals
  • Reference-based in-band OSNR measurement on polarization-multiplexed signals

Examples


example 1

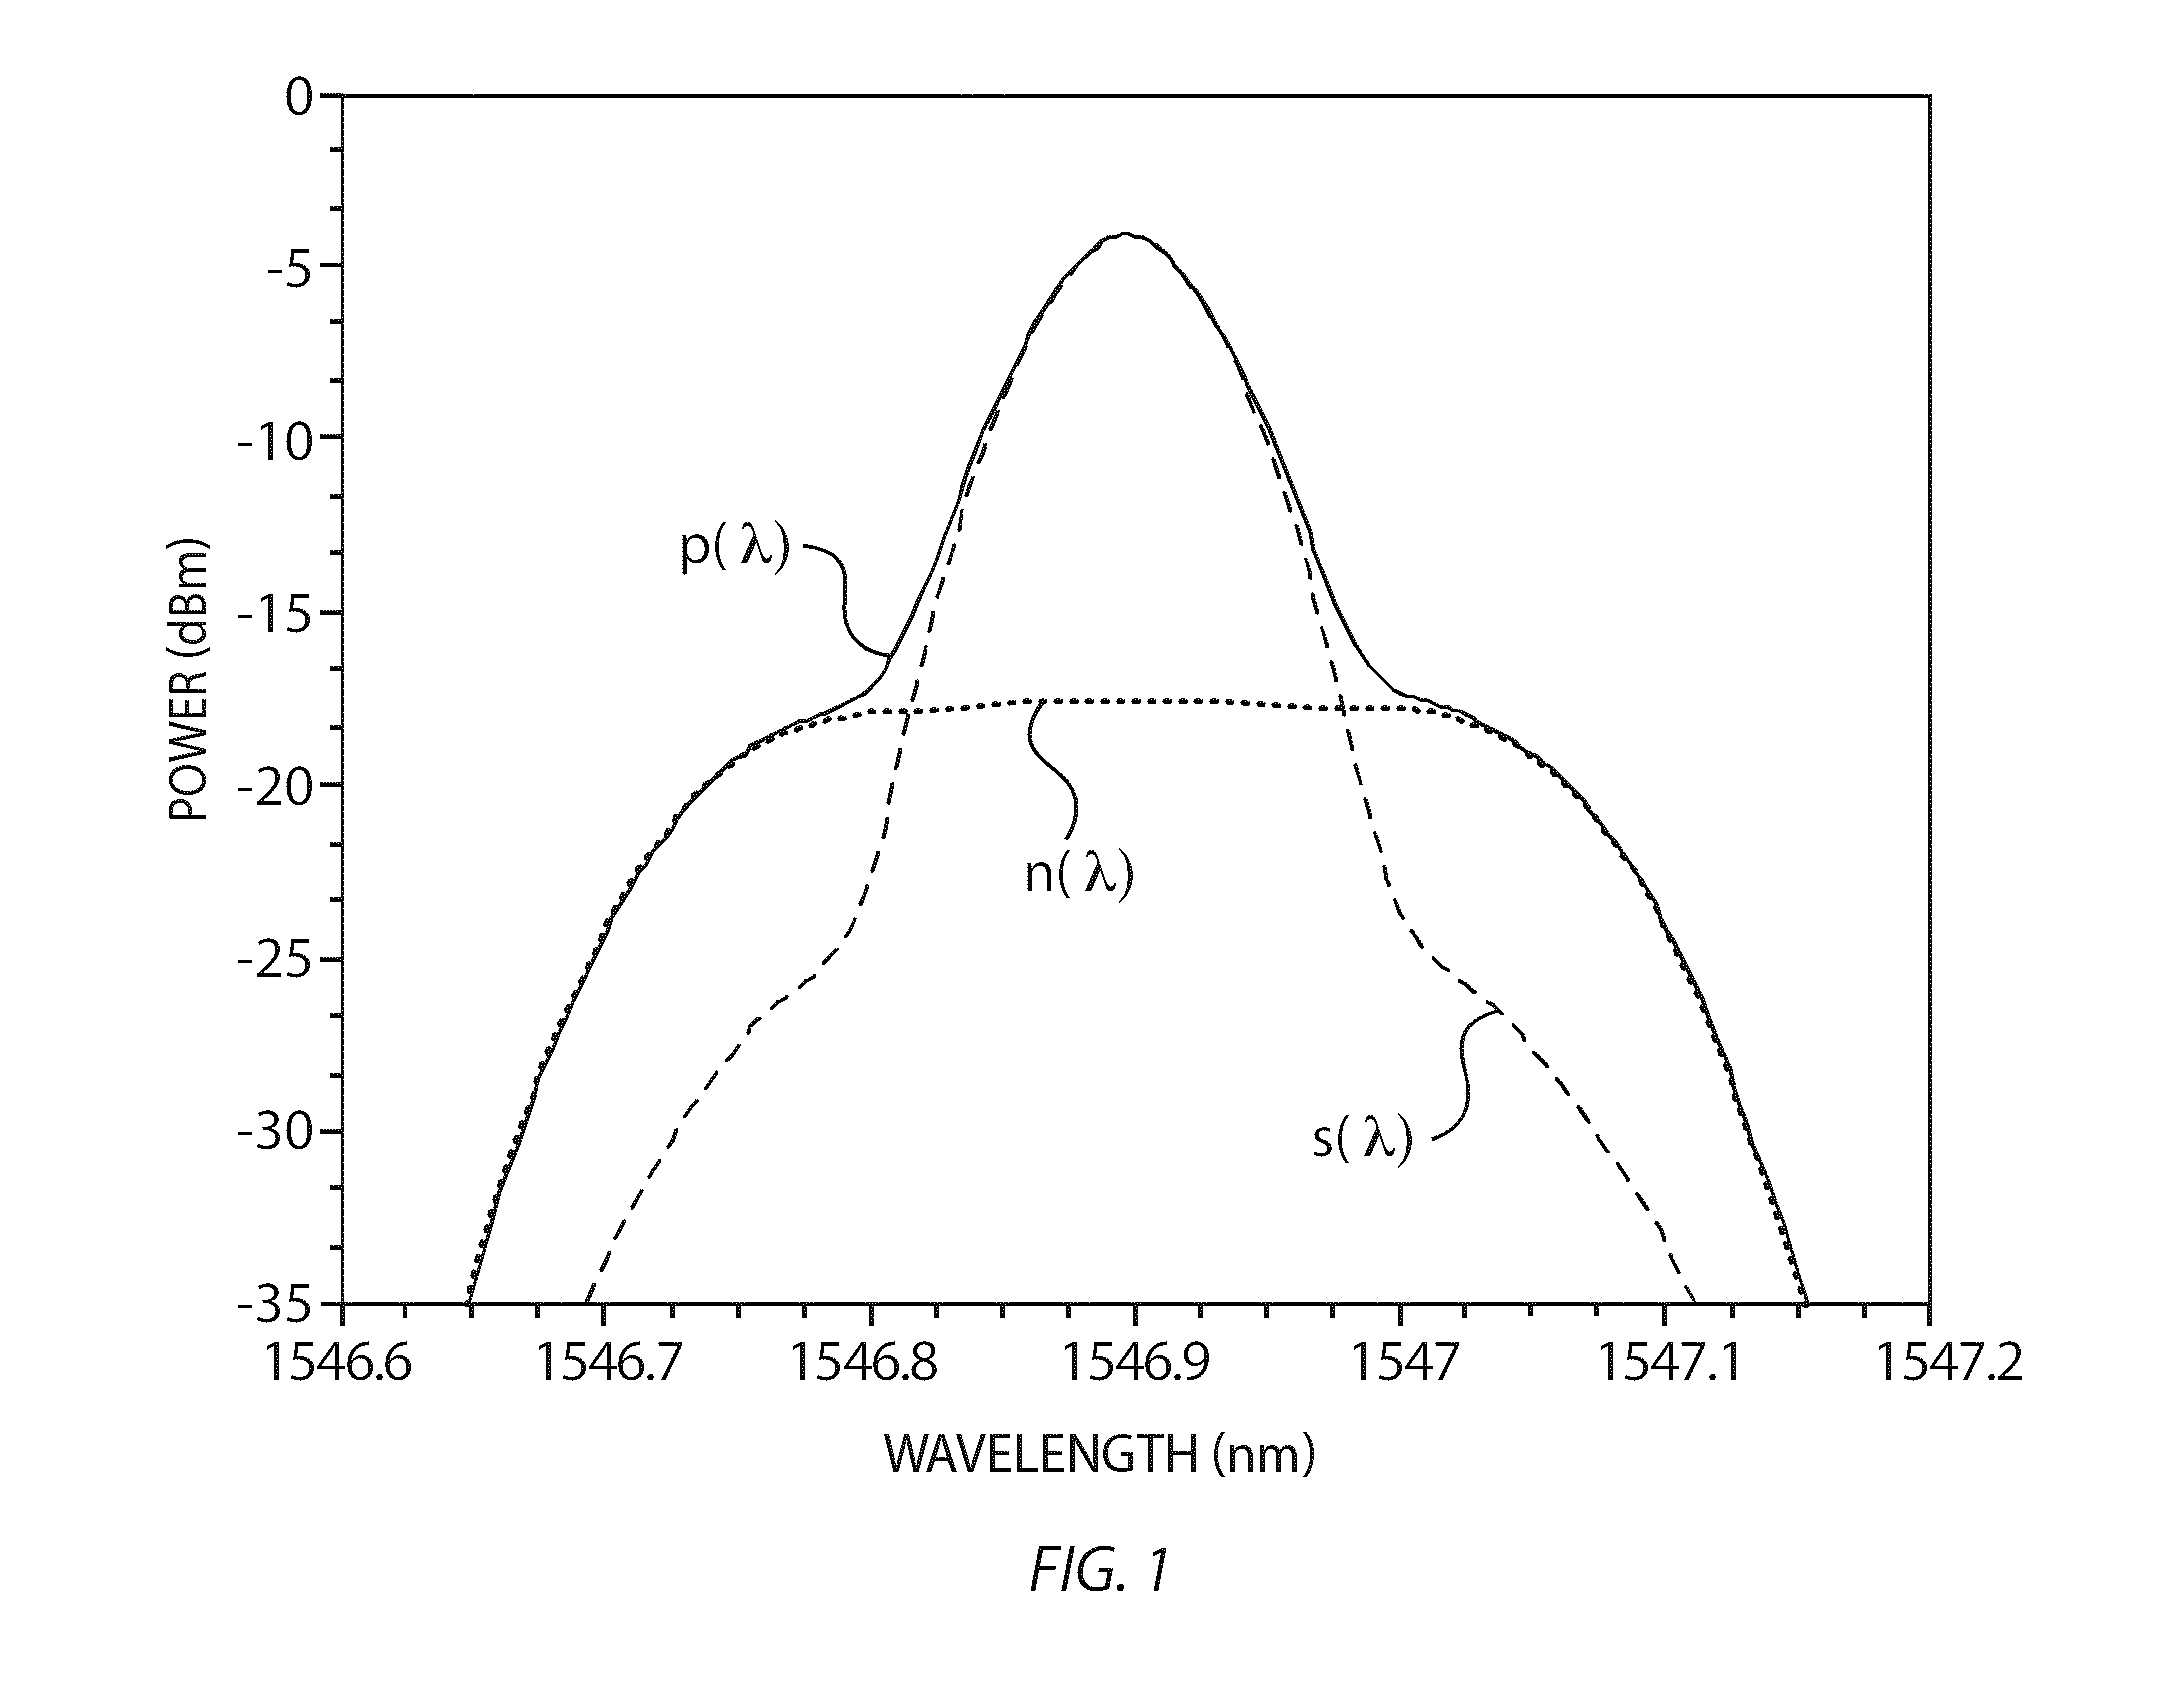
[0065]FIG. 5 illustrates an embodiment of a processing algorithm used to estimate the noise contribution on the trace P(λ) of the SUT obtained at Tap 3, using the reference trace R(λ) obtained at Tap 1. The processing algorithm is based on the method of FIG. 4. In this example case, the spectral shape Sh(λ) corresponds to the reference trace R(λ) (step 406). The ratio K is estimated by calculating the ratio between the maximum value of trace P(λ) and the maximum value of the reference trace R(λ) (step 408):

K=max(P(λ)) / max(R(λ))

[0066]In this case, K=4.426. The spectrally-resolved trace of the signal contribution and the noise contribution of the SUT are respectively the estimated as follows (step 410):

Se(λ)=K·R(λ)

Ne(λ)=P(λ)−K·R(λ)

[0067]In is noted that because this estimation of K assumes a negligible noise contribution on trace P(λ) of the SUT at the peak wavelength, the estimation of the noise contribution Ne(λ) cannot be valid at wavelengths in the vicinity of the peak wavelength....

example 2

[0069]It is noted that this processing algorithm does not necessarily require a spectral-resolved point-by-point analysis. In a second example embodiment, data is obtained at three different resolution bandwidths, for example the “physical resolution” of the OSA, a 0.1-nm resolution bandwidth and a 0.2-nm resolution bandwidth.

[0070]This example also assumes a negligible noise contribution on the reference signal such that Sh(λ)=R(λ) (step 406).

[0071]The process is then as follows:

[0072]The reference trace R(λ) is acquired (in this example, at Tap 1) and the peak power R(λpk) is determined.

[0073]A second R0.1(λ) and a third R0.2(λ) reference traces are obtained either by performing additional acquisitions of the reference signal using respectively a first and a second resolution bandwidth RBW1, RBW2, e.g. 0.1-nm and 0.2-nm resolution bandwidths in this case, or by integrating trace R(λ) in software. The peak powers of these traces R0.1(λpk), R0.2(λpk) are then determined.

[0074]The tr...

example 3

[0082]FIG. 6 illustrates another embodiment of a processing algorithm used to estimate the noise contribution on the trace P(λ) of the SUT obtained at Tap 3, using the reference trace R(λ) obtained at Tap 1. The processing algorithm is based on the method of example 1 but uses a different processing algorithm to estimate the ratio K.

[0083]This example also assumes a negligible noise contribution on the reference signal such that Sh(λ)=R(λ) (step 406).

[0084]This processing algorithm is made using measurements made at two distinct wavelengths λ1 and λ2 that are within the optical signal bandwidth of the SUT and generally positioned on the same side of the peak of the SUT. By assuming a uniform noise distribution within the optical signal bandwidth and therefore a substantially equal noise level at λ1 and λ2 on the trace P(λ) and trace R(λ), we find:

[0085]P⁡(λ2)-P⁡(λ1)=⁢S⁡(λ2)-S⁡(λ1)=⁢S⁡(λ1)⁢(S⁡(λ2)S⁡(λ1)-1)=⁢S⁡(λ1)⁢(R⁡(λ2)R⁡(λ1)-1)=⁢S⁡(λ1)R⁡(λ1)⁢(R⁡(λ2)-R⁡(λ1))

and the ratio K is then ...


PUM


Abstract

There is provided a method for determining an in-band noise parameter, such as the Optical Signal-to-Noise Ratio (OSNR), on an optical signal-under-test (SUT) propagating along an optical communication link and comprising a data-carrying signal contribution of any arbitrary degree of polarization and a noise contribution. A spectral shape trace of data-carrying signal contribution in the SUT is estimated using a reference optical spectrum trace of a reference signal which comprises a data-carrying signal contribution that is spectrally representative of the data-carrying signal contribution of the SUT and a noise contribution which is at least approximately known. The data-carrying signal contribution is mathematically discriminated from said noise contribution in the SUT using the spectral shape trace and the test optical spectrum trace. The in-band noise parameter is then determined at least from the mathematically discriminated noise contribution.

Description

CROSS-REFERENCE TO RELATED APPLICATIONS[0001]This application claims priority under 35 USC §119(e) of U.S. provisional patent application(s) 61 / 304,584 filed Feb. 15, 2010; the specification of which is hereby incorporated by reference.TECHNICAL FIELD[0002]The invention relates to the determination of the in-band noise in optical telecommunication applications. More specifically, the invention relates to the determination of the in-band noise on polarization-multiplexed optical signals.BACKGROUND OF THE ART[0003]In order to maximize the information content transmitted over a given spectral bandwidth (often measured in bits per Hz of spectral bandwidth), polarization multiplexing (referred to as “Pol-Mux”) is being increasingly used with new transmission formats. The underlying idea is that the spectral density (conveniently measured in units of bits / Hz) can be effectively doubled by employing two orthogonally polarized data-carrying signals sharing the same optical signal bandwidth....

Claims


Application Information

Patent Timeline
Patent Type & Authority Patents(United States)
IPC IPC(8): H04B17/00H04B10/079
CPCH04B10/07953
Inventor GARIEPY, DANIELHE, GANG
Owner EXFO
Why Eureka
Try Eureka