Signal deformation measurement on polarization-multiplexed signals

a technology of polarization-multiplexed optical signals and signal deformation, which is applied in the direction of electrical equipment, transmission monitoring, electromagnetic transmission, etc., can solve the problems that the above-mentioned in-band osnr measurement methods cannot be used to reliably provide osnr measurement, requires certain assumptions, and limits the use of this techniqu

Active Publication Date: 2014-11-06
EXFO
View PDF8 Cites 18 Cited by
  • Summary
  • Abstract
  • Description
  • Claims
  • Application Information

AI Technical Summary

Benefits of technology

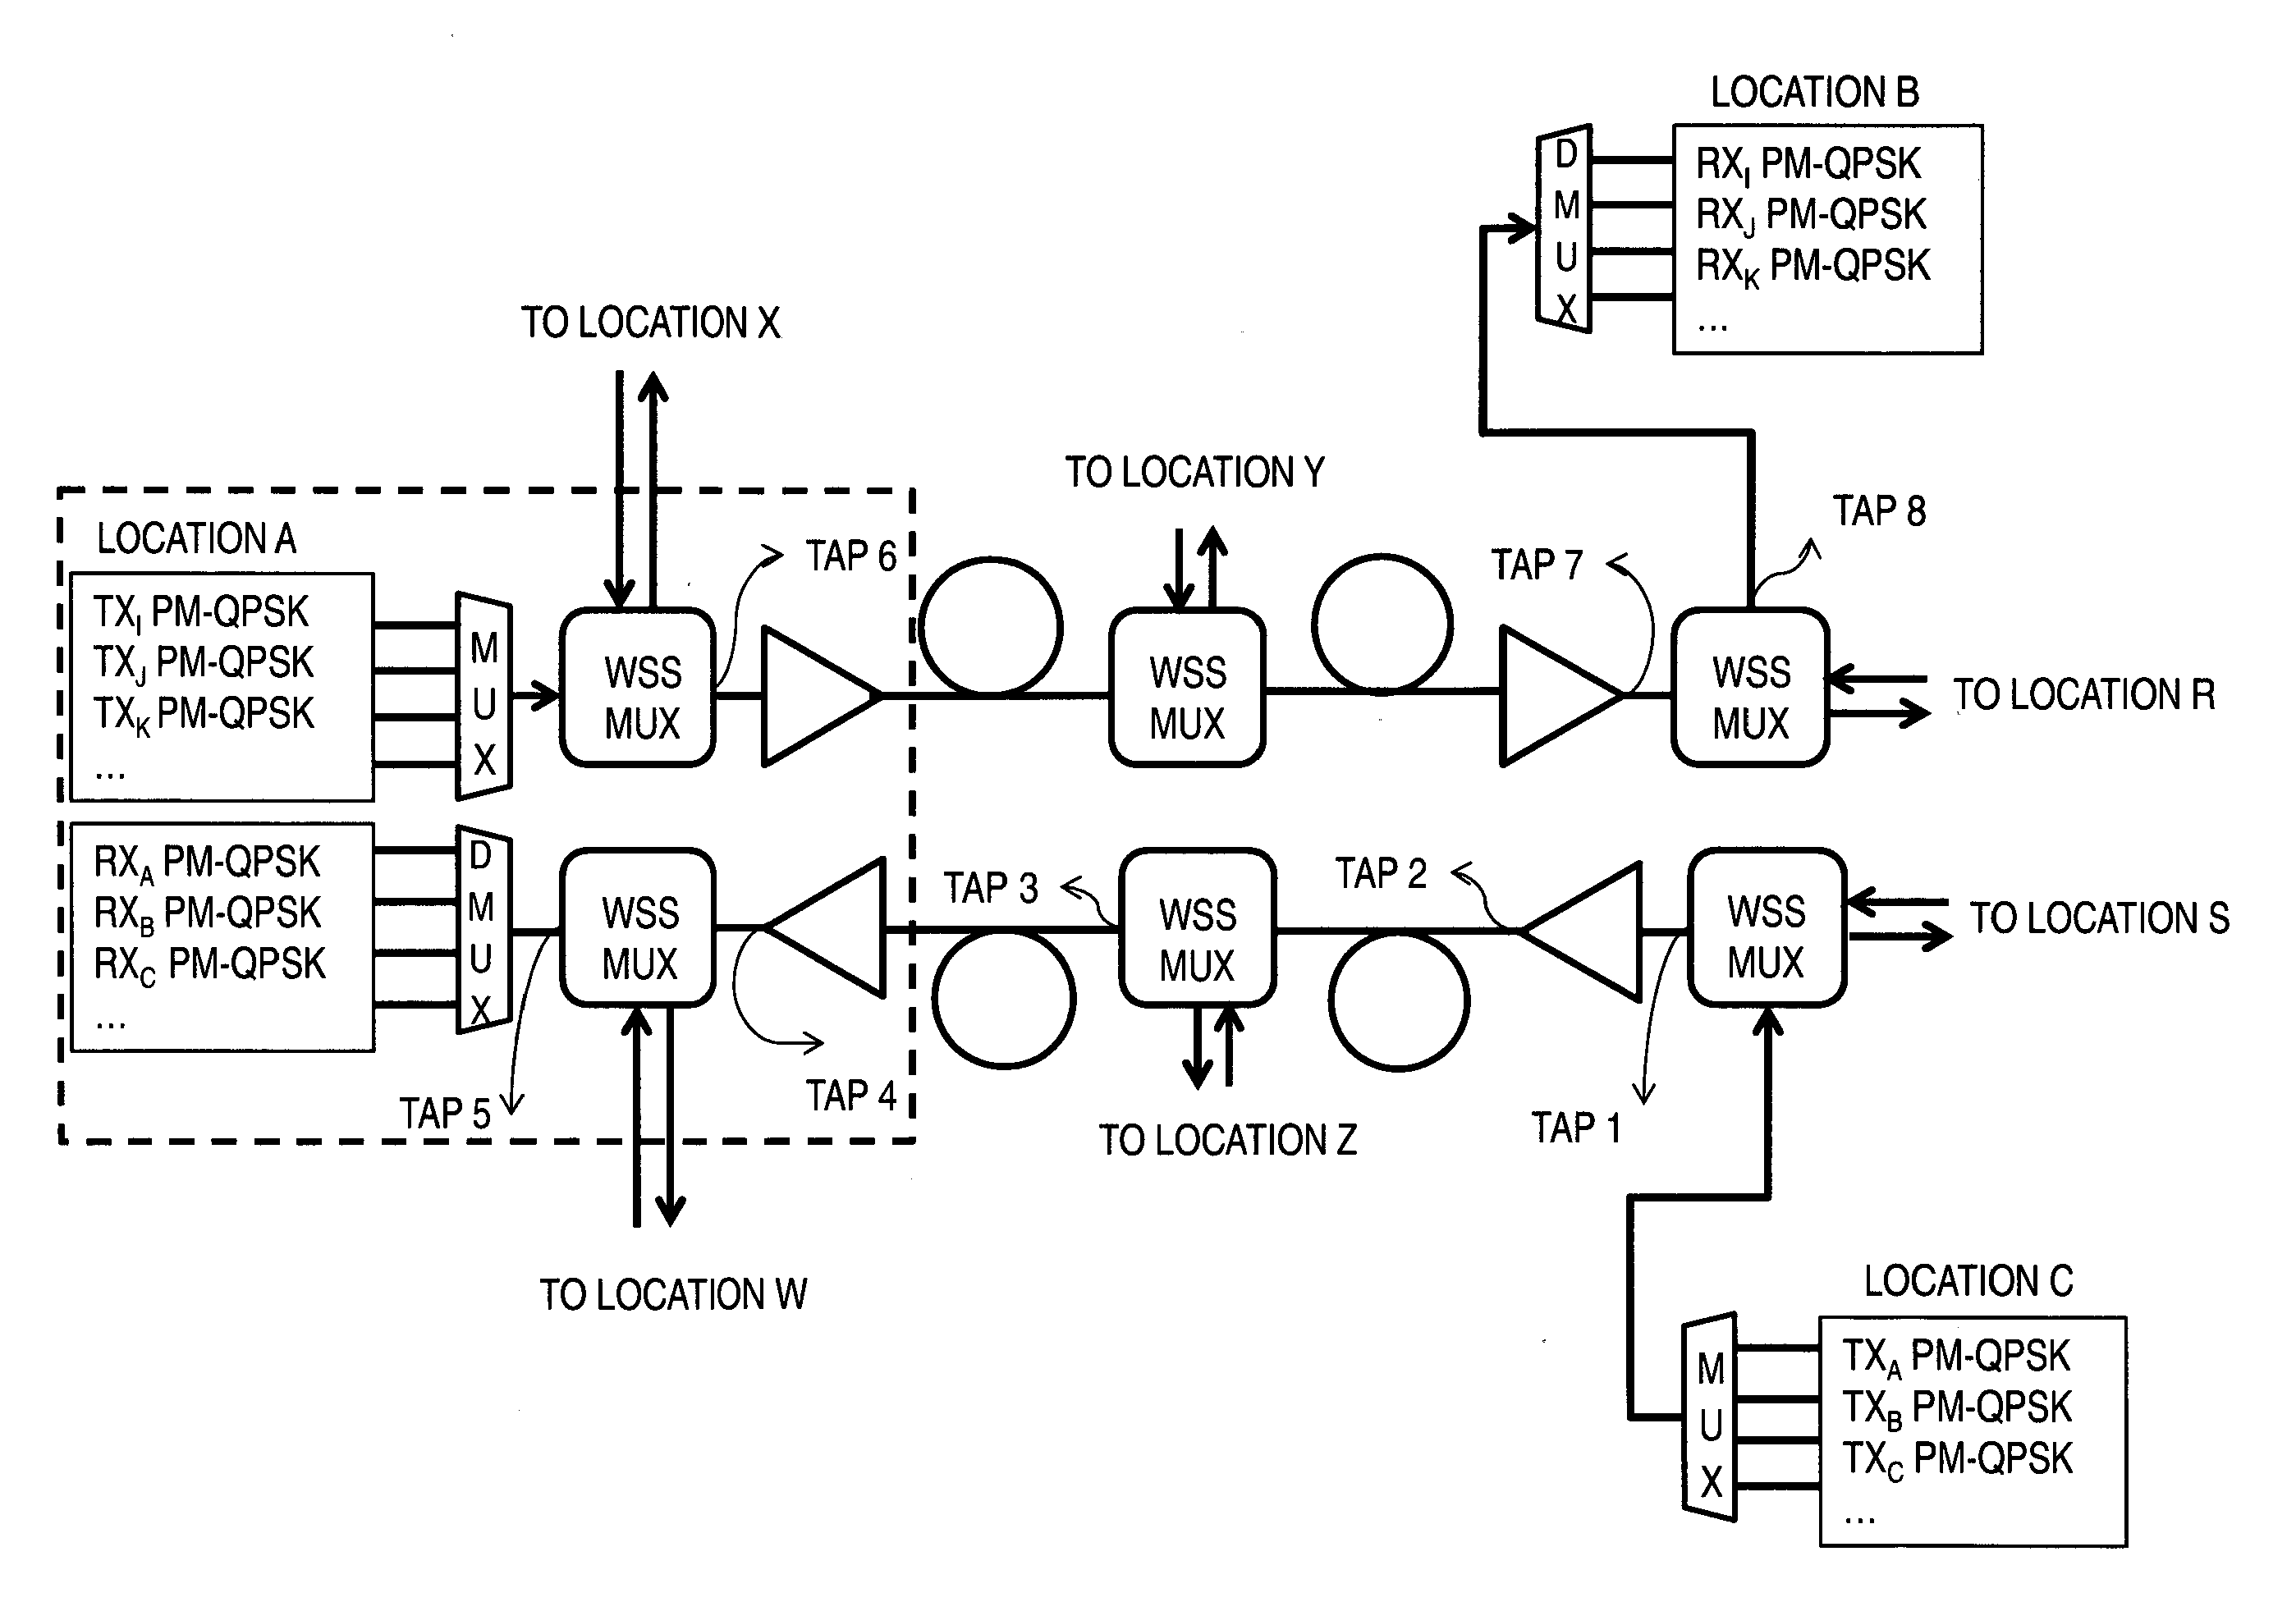
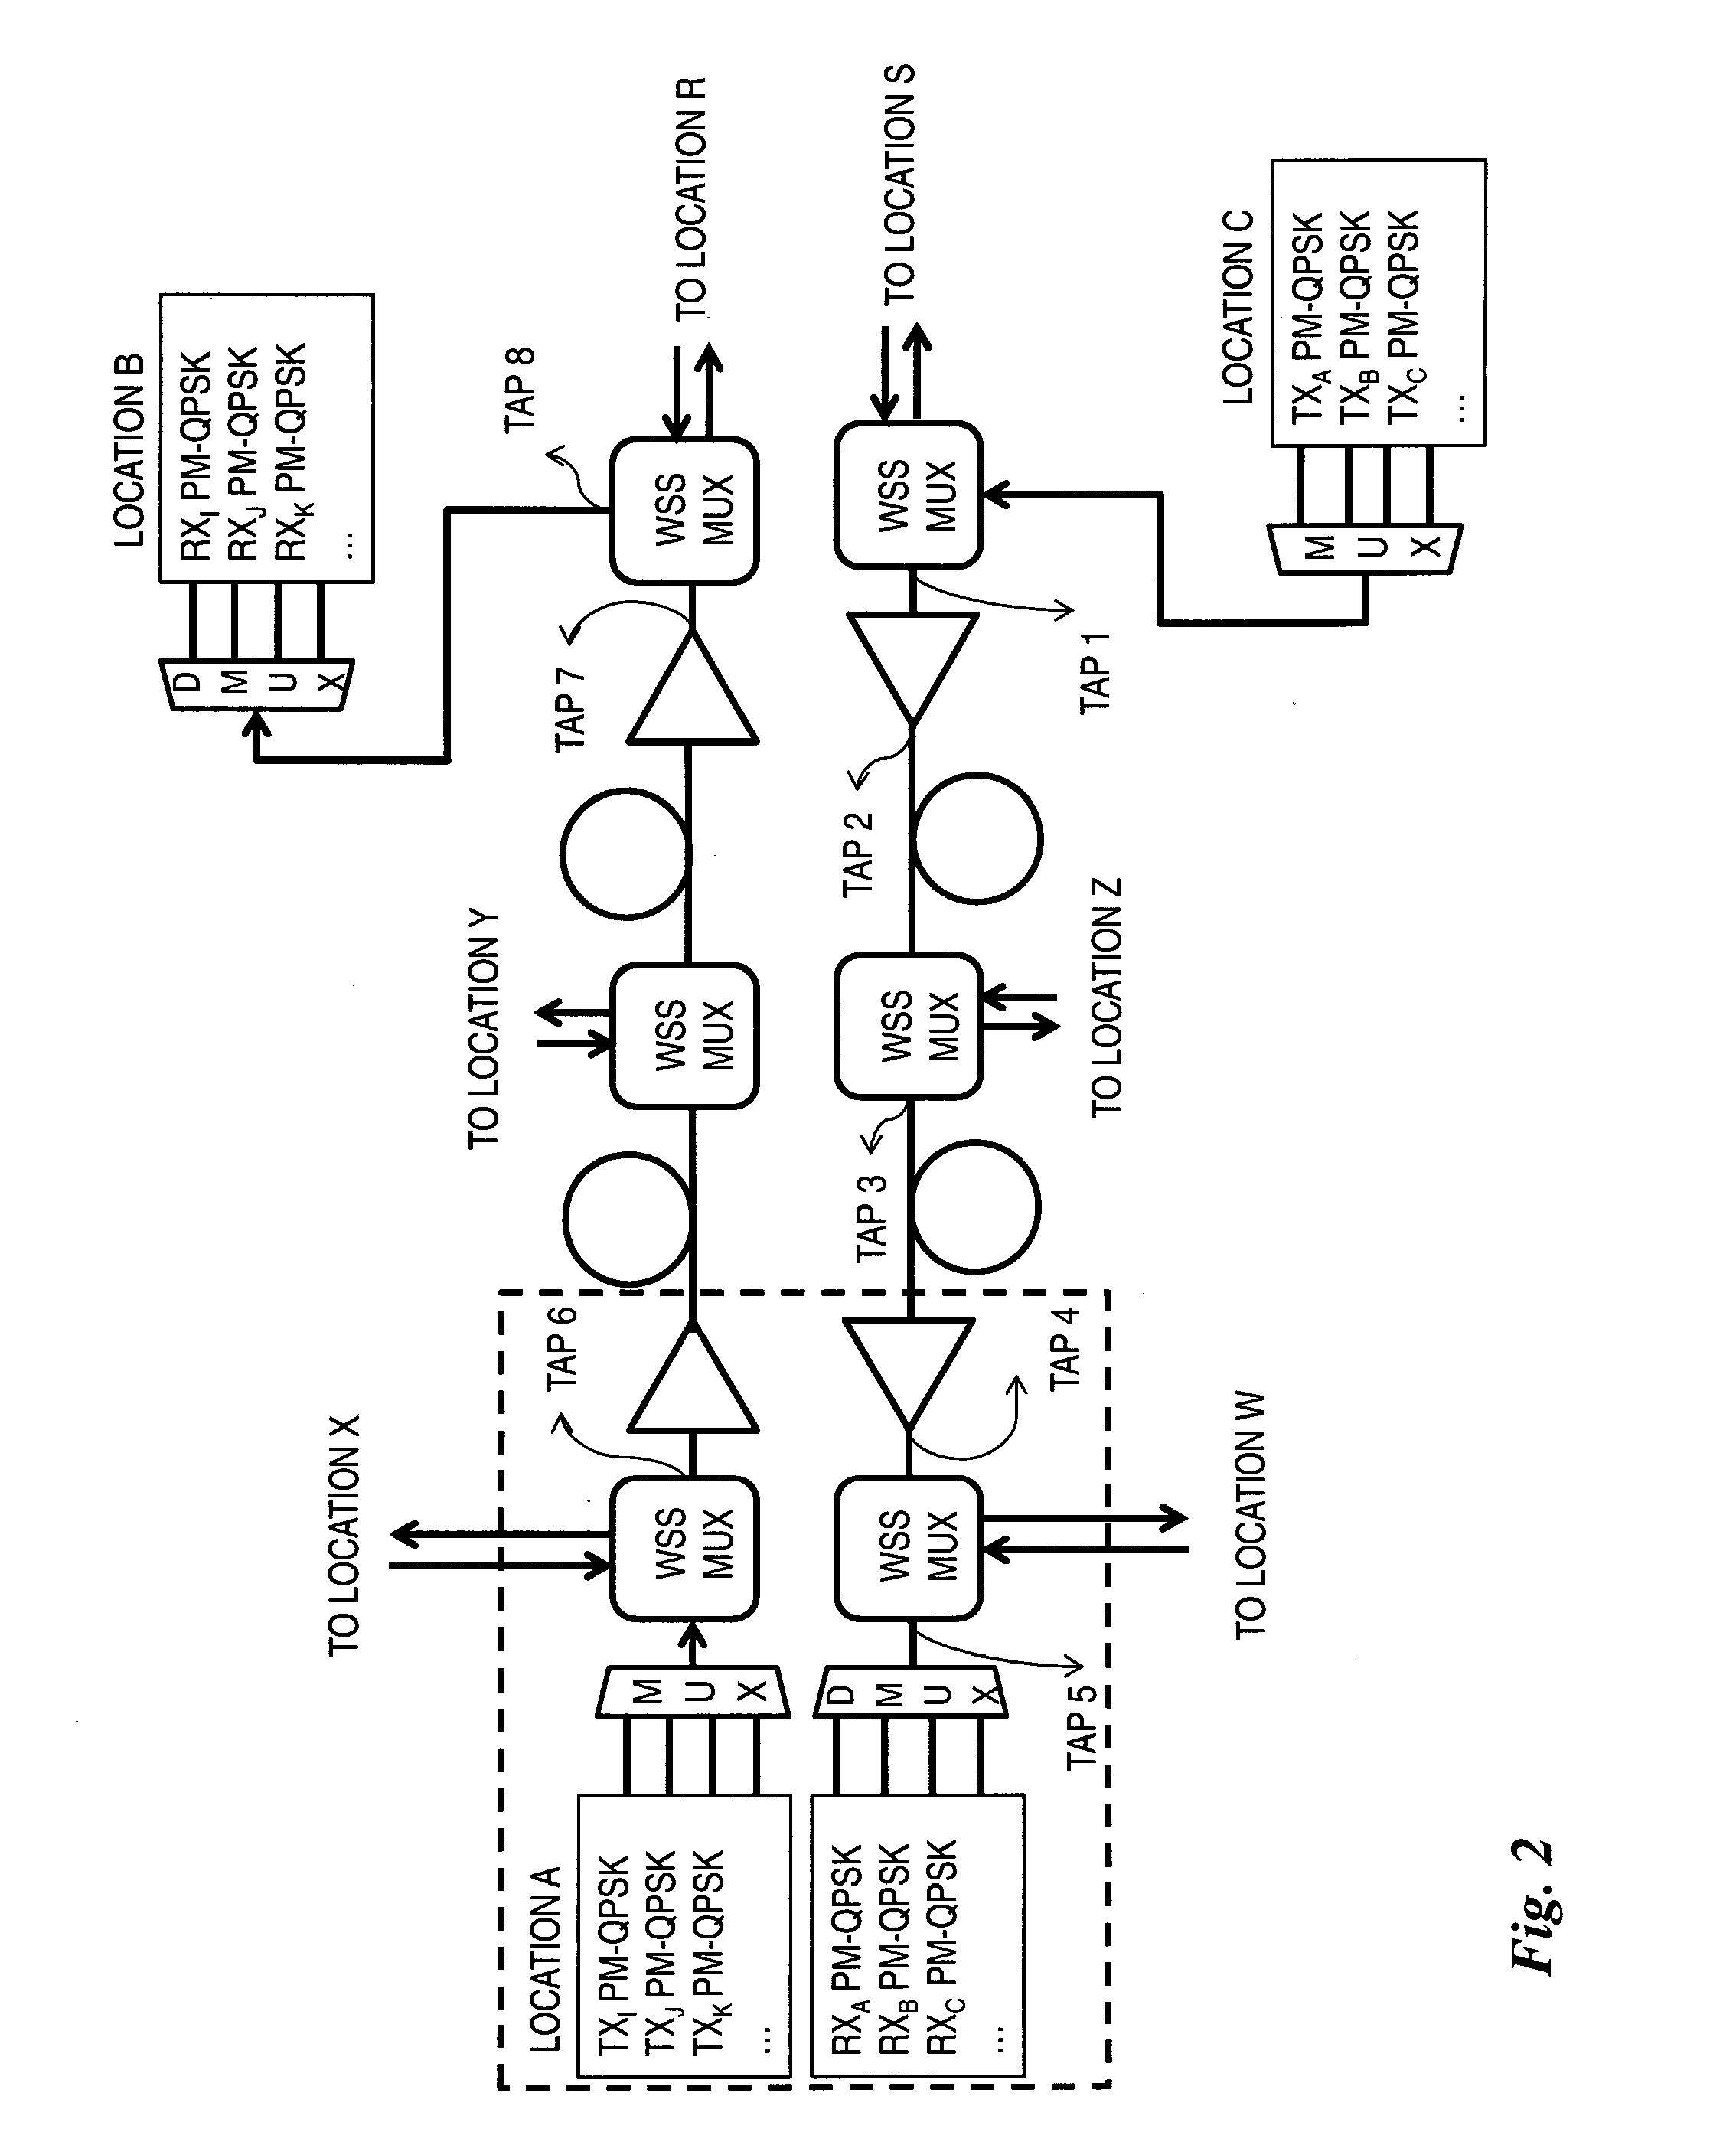
[0014]Of the embodiments described herein, those which use a reference signal taken at a different point along the same optical communication link typically minimize the measurement uncertainties.
[0019]It is however noted that it is very important that the reference trace be representative of the signal contribution of the SUT before being affected by NLE-induced spectral deformation, at least over a given spectral range of interest, thus allowing retrieval of a reference trace that is substantially identical (within the acquisition device repeatability) to the signal contribution of the SUT using only basic mathematical processing (such as a translation and a scale transformation). It has been shown that in at least some cases of 40G transmission applications, it is possible to obtain a sufficiently representative reference by employing a generic optical transmitter.
[0020]It is further noted that the provided method only requires knowledge of the spectral power density over the optical signal bandwidth, i.e. the relative distribution of the optical power, for both the SUT and the reference signal. No absolute power level value is required. Hence, the optical spectrum traces can be acquired via tap monitoring ports on the optical communication link for example, thus allowing non-intrusive measurement (i.e. without any service interruption).

Problems solved by technology

However, such methods are based on the assumption that the signal is generally highly polarized, an assumption that is not valid in the case of polarization-multiplexed signals.
For the case of most polarization-multiplexed signals, the “signal”, as detected on a photodiode having low bandwidth electronics for instance, appears unpolarized, and hence, these above-mentioned in-band OSNR measurement methods cannot be used to reliably provide the OSNR measurement.
A first limitation of this method is that it requires making certain assumptions about the noise variations that occur upon turning off the signal for which the OSNR needs to be measured.
For systems with live traffic, the necessary service interruption resulting from signal turn-off practically limits the use of this technique to a start of life characterization at the time of commissioning a system.
However, spectral deformations mostly induced by Non-Linear Effects (NLE) have become more frequent in the case of new deployments using polarization multiplexing, because optimum performance in Bit Error Rate (BER) is obtained by increasing the power beyond the linear regime of optical fibers, non-linear effects therefore arising.
Furthermore, aside from the ASE-noise level, non-linear effects now also significantly affect the overall system performance in terms of BER (see Vacondio et al, “On nonlinear distorsions of highly dispersive optical coherent systems”, Optics Express, Vol. 20, No. 2, pp.

Method used


Image

  • Signal deformation measurement on polarization-multiplexed signals
  • Signal deformation measurement on polarization-multiplexed signals
  • Signal deformation measurement on polarization-multiplexed signals

Examples


first embodiment

[0078]FIG. 5 illustrates the method 400 described hereinabove for determining a quality parameter characterizing a polarization-multiplexed SUT. The method 500 of FIG. 5 gives one specific implementation algorithm of how the test trace PSUT(λ) and the reference trace Sref(λ) may be processed to estimate the spectral deformation k(λ) of the signal contribution of the SUT as compared to the reference trace. The method 500 of FIG. 5 is illustrated here for the specific case of 100G PM-QPSK signals.

[0079]The method 500 of FIG. 5 is based on the following approach which uses the ratio Rdev(λ) of the derivative of the test optical spectrum trace as a function of wavelength with respect to the derivative of the reference optical spectrum trace as a function of wavelength. Knowing that

Rdev(λ)=PSUT(λ) / λSref(λ) / λ=k(λ)+k(λ)λ·Sref(λ)Sref(λ) / λ(5.1)

[0080]By deriving Rdev(λ) and neglecting the term including the second derivative of k(λ), we obtain:

Rdev(λ)λ≈k(λ)λ·(2-2Sref(λ)2λ·Sref(λ)Sref(λ) / λ)(5....

second embodiment

[0110]FIG. 6 illustrates the method 400 described hereinabove for determining a quality parameter characterizing a polarization-multiplexed SUT. The method 600 of FIG. 6 gives another specific implementation algorithm for processing the test trace PSUT(λ) and the reference trace Sref(λ) in order to estimate the spectral deformation k(λ) of the signal contribution of the SUT, via a comparison with the reference trace and / or the ASE-only noise comprised in the SUT.

[0111]In most cases, the spectral deformation of the SUT as it propagates along an optical communication link will be manifest as a spectral broadening of the optical signal. The specific method 600 of FIG. 6 is based on this premise.

[0112]The method 600 is also based on the use of the ratio Rdev(λ) (equation (5.1)). However, instead of calculating the ASE-noise contribution NASE from a first estimation ke1(λ) of the signal deformation function, method 600 first evaluates an extended noise contribution NE(λ), as defined here...


PUM


Abstract

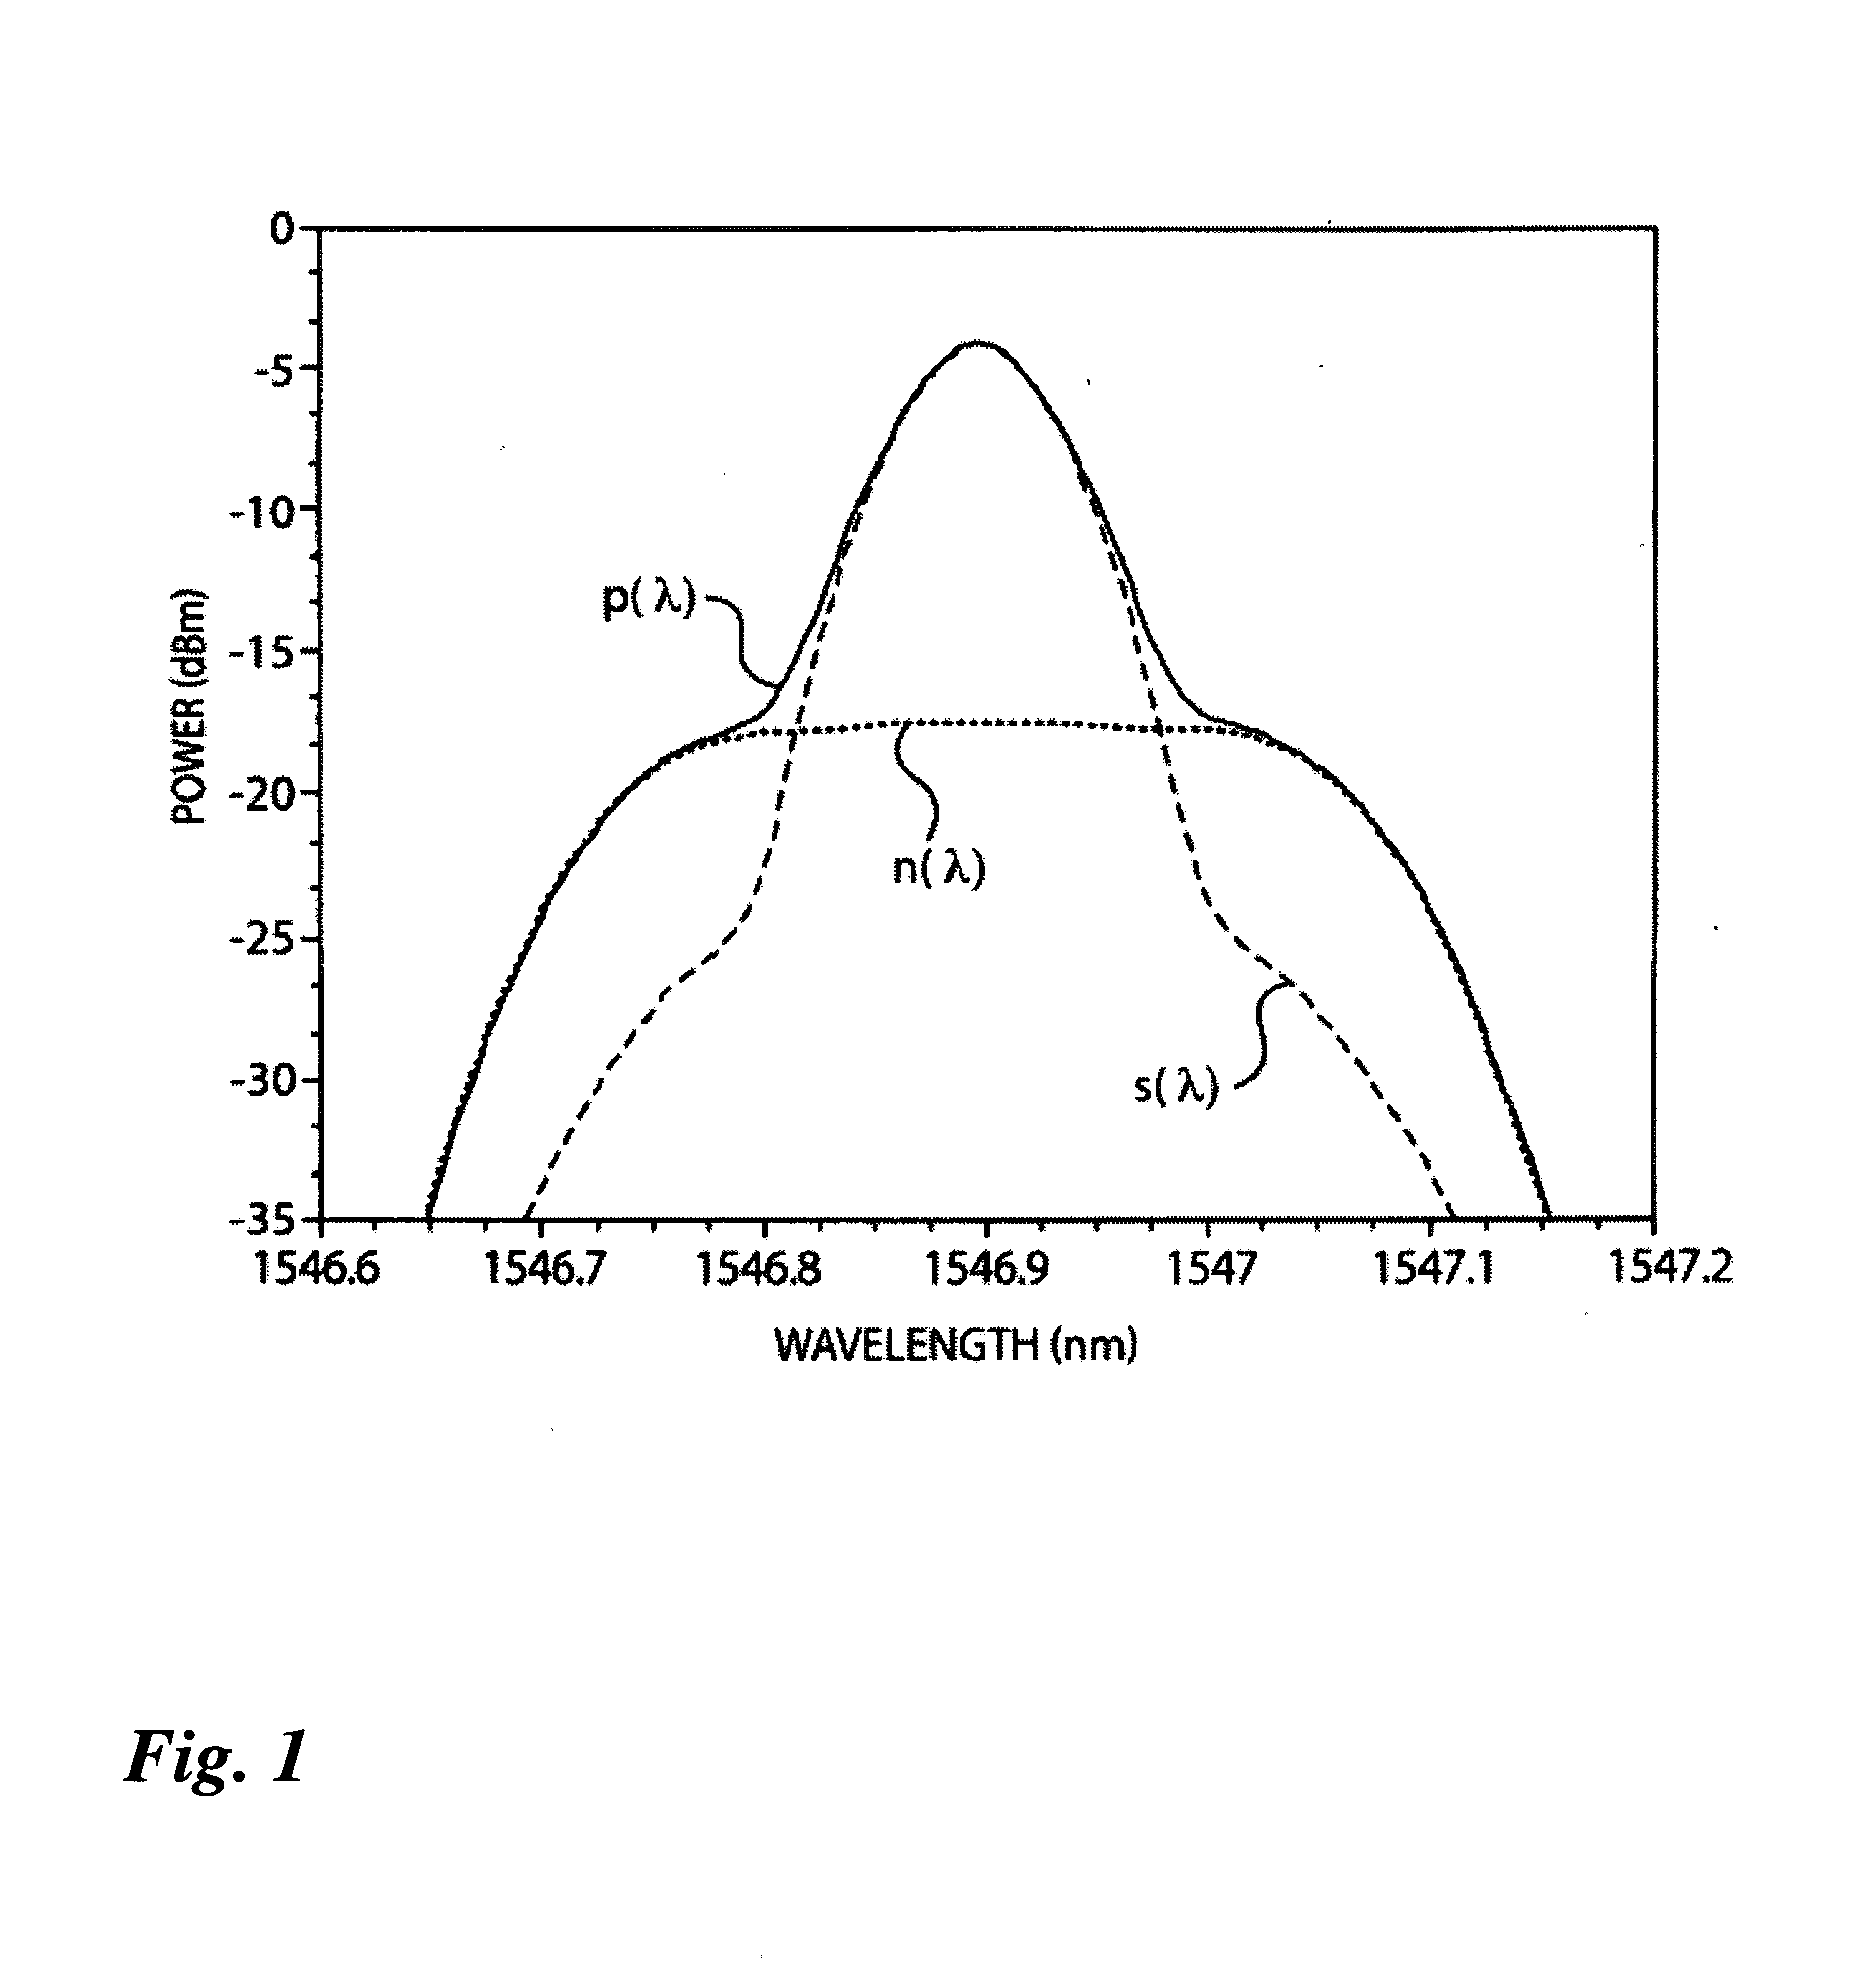
There is provided a method and an apparatus for determining quality parameters on a polarization-multiplexed optical signal based on an analysis of the power spectral density of the Signal-Under-Test (SUT). The method is predicated upon knowledge of the spectral shape of the signal in the absence of significant noise or spectral deformation. This knowledge is provided by a reference optical spectrum trace. Based on this knowledge and under the assumption that ASE noise level is approximately constant in wavelength over a given spectral range, the spectral deformation of the signal contribution of the SUT may be estimated using a comparison of the spectral variations of the optical spectrum trace of the SUT with that of the reference optical spectrum trace.

Description

CROSS-REFERENCE TO RELATED APPLICATIONS[0001]This application claims priority under 35USC§119(e) of US provisional patent application(s) 61 / 818,952 filed May 3, 2013; the specification of which is hereby incorporated by reference.TECHNICAL FIELD[0002]The invention relates to the determination of a quality parameter characterizing optical signals based on an analysis of the power spectral density of the signal. More specifically, the invention relates to the determination of a quality parameter characterizing polarization-multiplexed optical signals.BACKGROUND OF THE ART[0003]In order to maximize the information content transmitted over a prescribed spectral bandwidth (often measured in bits per Hz of spectral bandwidth), polarization multiplexing (also known as dual-polarization) is being increasingly used with new transmission formats. The underlying idea is that the spectral density (conveniently measured in units of bits / Hz) can be effectively doubled by employing two orthogonall...

Claims


Application Information

Patent Timeline
Patent Type & Authority Applications(United States)
IPC IPC(8): H04B10/079H04J14/06
CPCH04B10/07953H04B10/07955H04J14/06
Inventor HE, GANGGARIEPY, DANIELSKOLD, MATS
Owner EXFO
Why Eureka
Try Eureka