Dynamic expansion of data visualizations

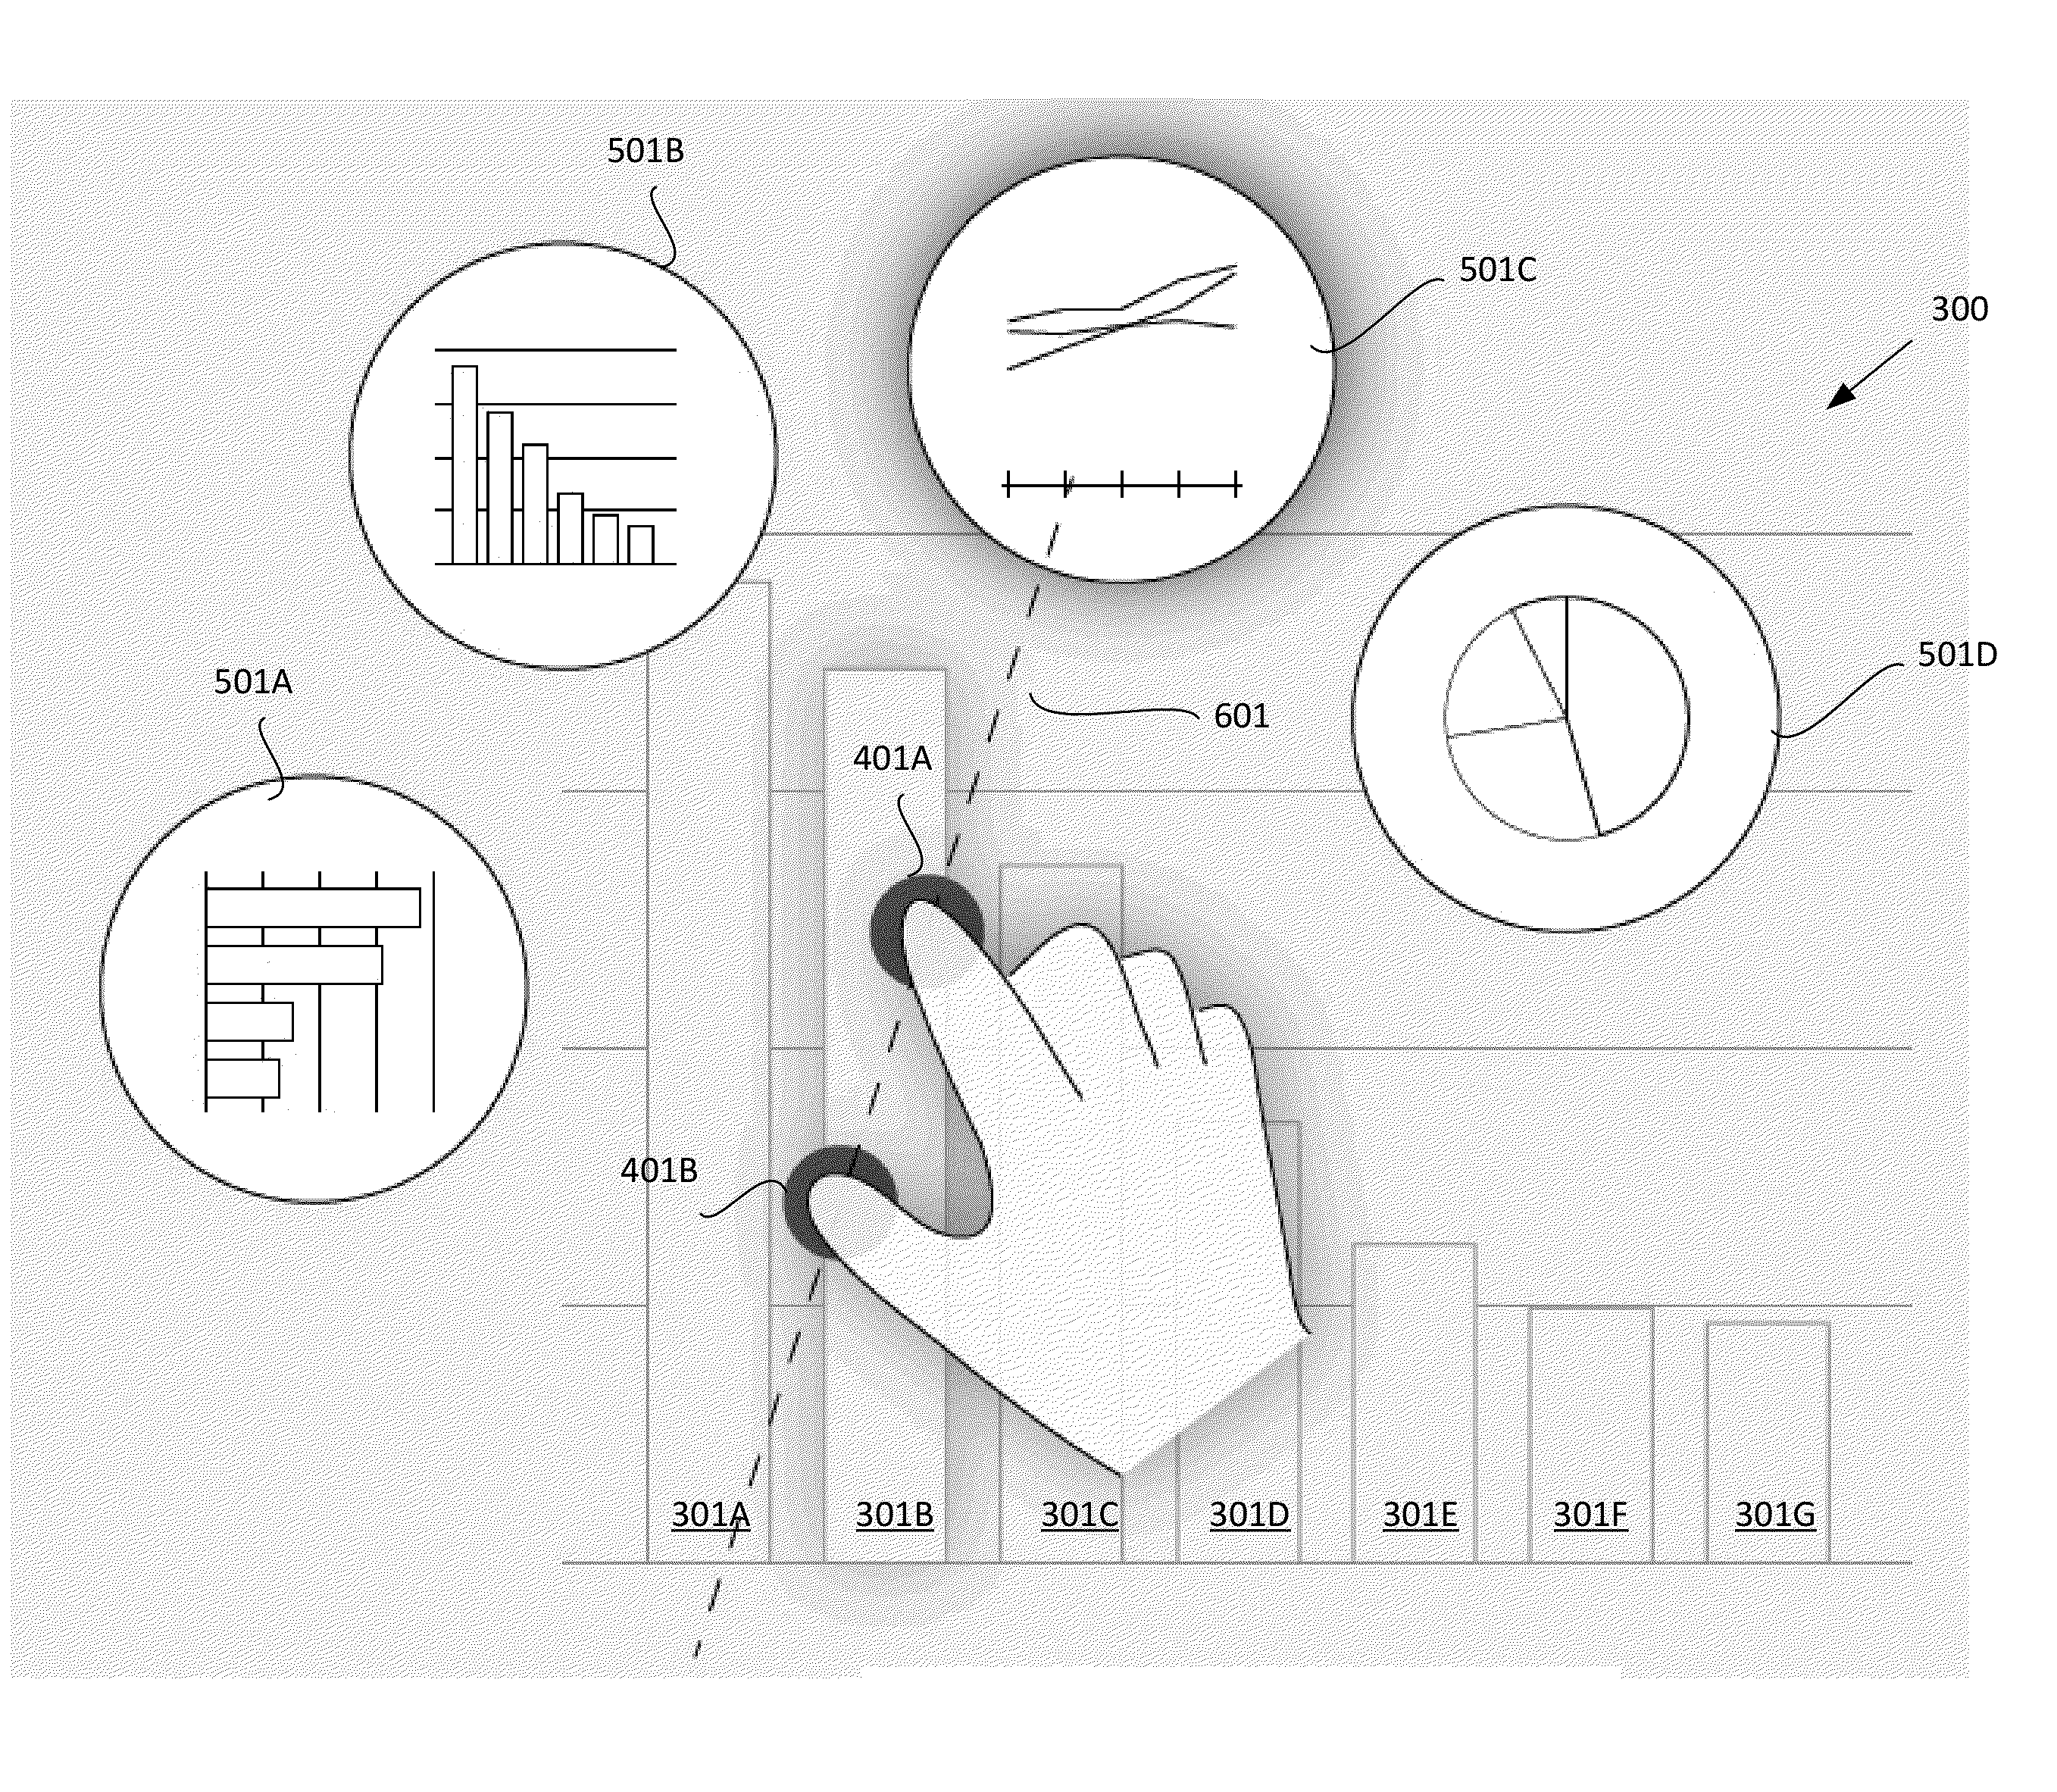
a data visualization and dynamic expansion technology, applied in the field of interactive graphical displays of data visualizations, can solve the problems of limited functionality of secondary report types, user's inability to interactively select among a plurality of available secondary report types or visualizations, and achieve the effects of high user-configurability, interactive and responsiveness

Active Publication Date: 2015-12-01
DOMO
View PDF53 Cites 53 Cited by
  • Summary
  • Abstract
  • Description
  • Claims
  • Application Information

AI Technical Summary

Benefits of technology

[0007]According to various embodiments of the present invention, a user interface is provided—for a computer or other electronic device that displays quantitative data in graphical form—which allows a user to dynamically invoke and control the display of secondary data visualizations based on a selected element of a primary data visualization. In at least one embodiment, previews of these secondary data visualizations are presented in response to user interaction with the primary visualization. In response to user input, one or more of the previews can be dynamically expanded. This allows a user to dynamically “drill down” into selected aspects and / or elements of the primary data visualization, in a manner that is highly user-configurable, interactive, and responsive.
[0008]In at least one embodiment, the system and method of the present invention are implemented in such a manner as to respond to direct manipulation of the displayed elements, for example via a touch-sensitive screen. Any touch-sensitive, proximity-sensitive, or gesture-based system can be used. Known gestures such as pinching and rotating can be interpreted in an intuitive manner to provide improved control and feedback in response to user input.
[0010]As described in more detail herein, in various embodiments, a hierarchy of visualizations can be established, and the user can navigate among primary, secondary, tertiary, and / or additional levels of visualizations in a similar interactive manner. The system and method of the present invention thereby provide an improved level of user control and interactivity in the display of visualizations on an electronic device.

Problems solved by technology

Yuen's technique, and similar techniques, offer limited functionality as to the type(s) of secondary report that can be generated, and as to the degree of user control of the nature and format of the secondary report.
The user is not generally able to interactively select among a plurality of available secondary reports or visualizations directly from the primary report.

Method used


Image

  • Dynamic expansion of data visualizations
  • Dynamic expansion of data visualizations
  • Dynamic expansion of data visualizations

Examples


Embodiment Construction

System Architecture

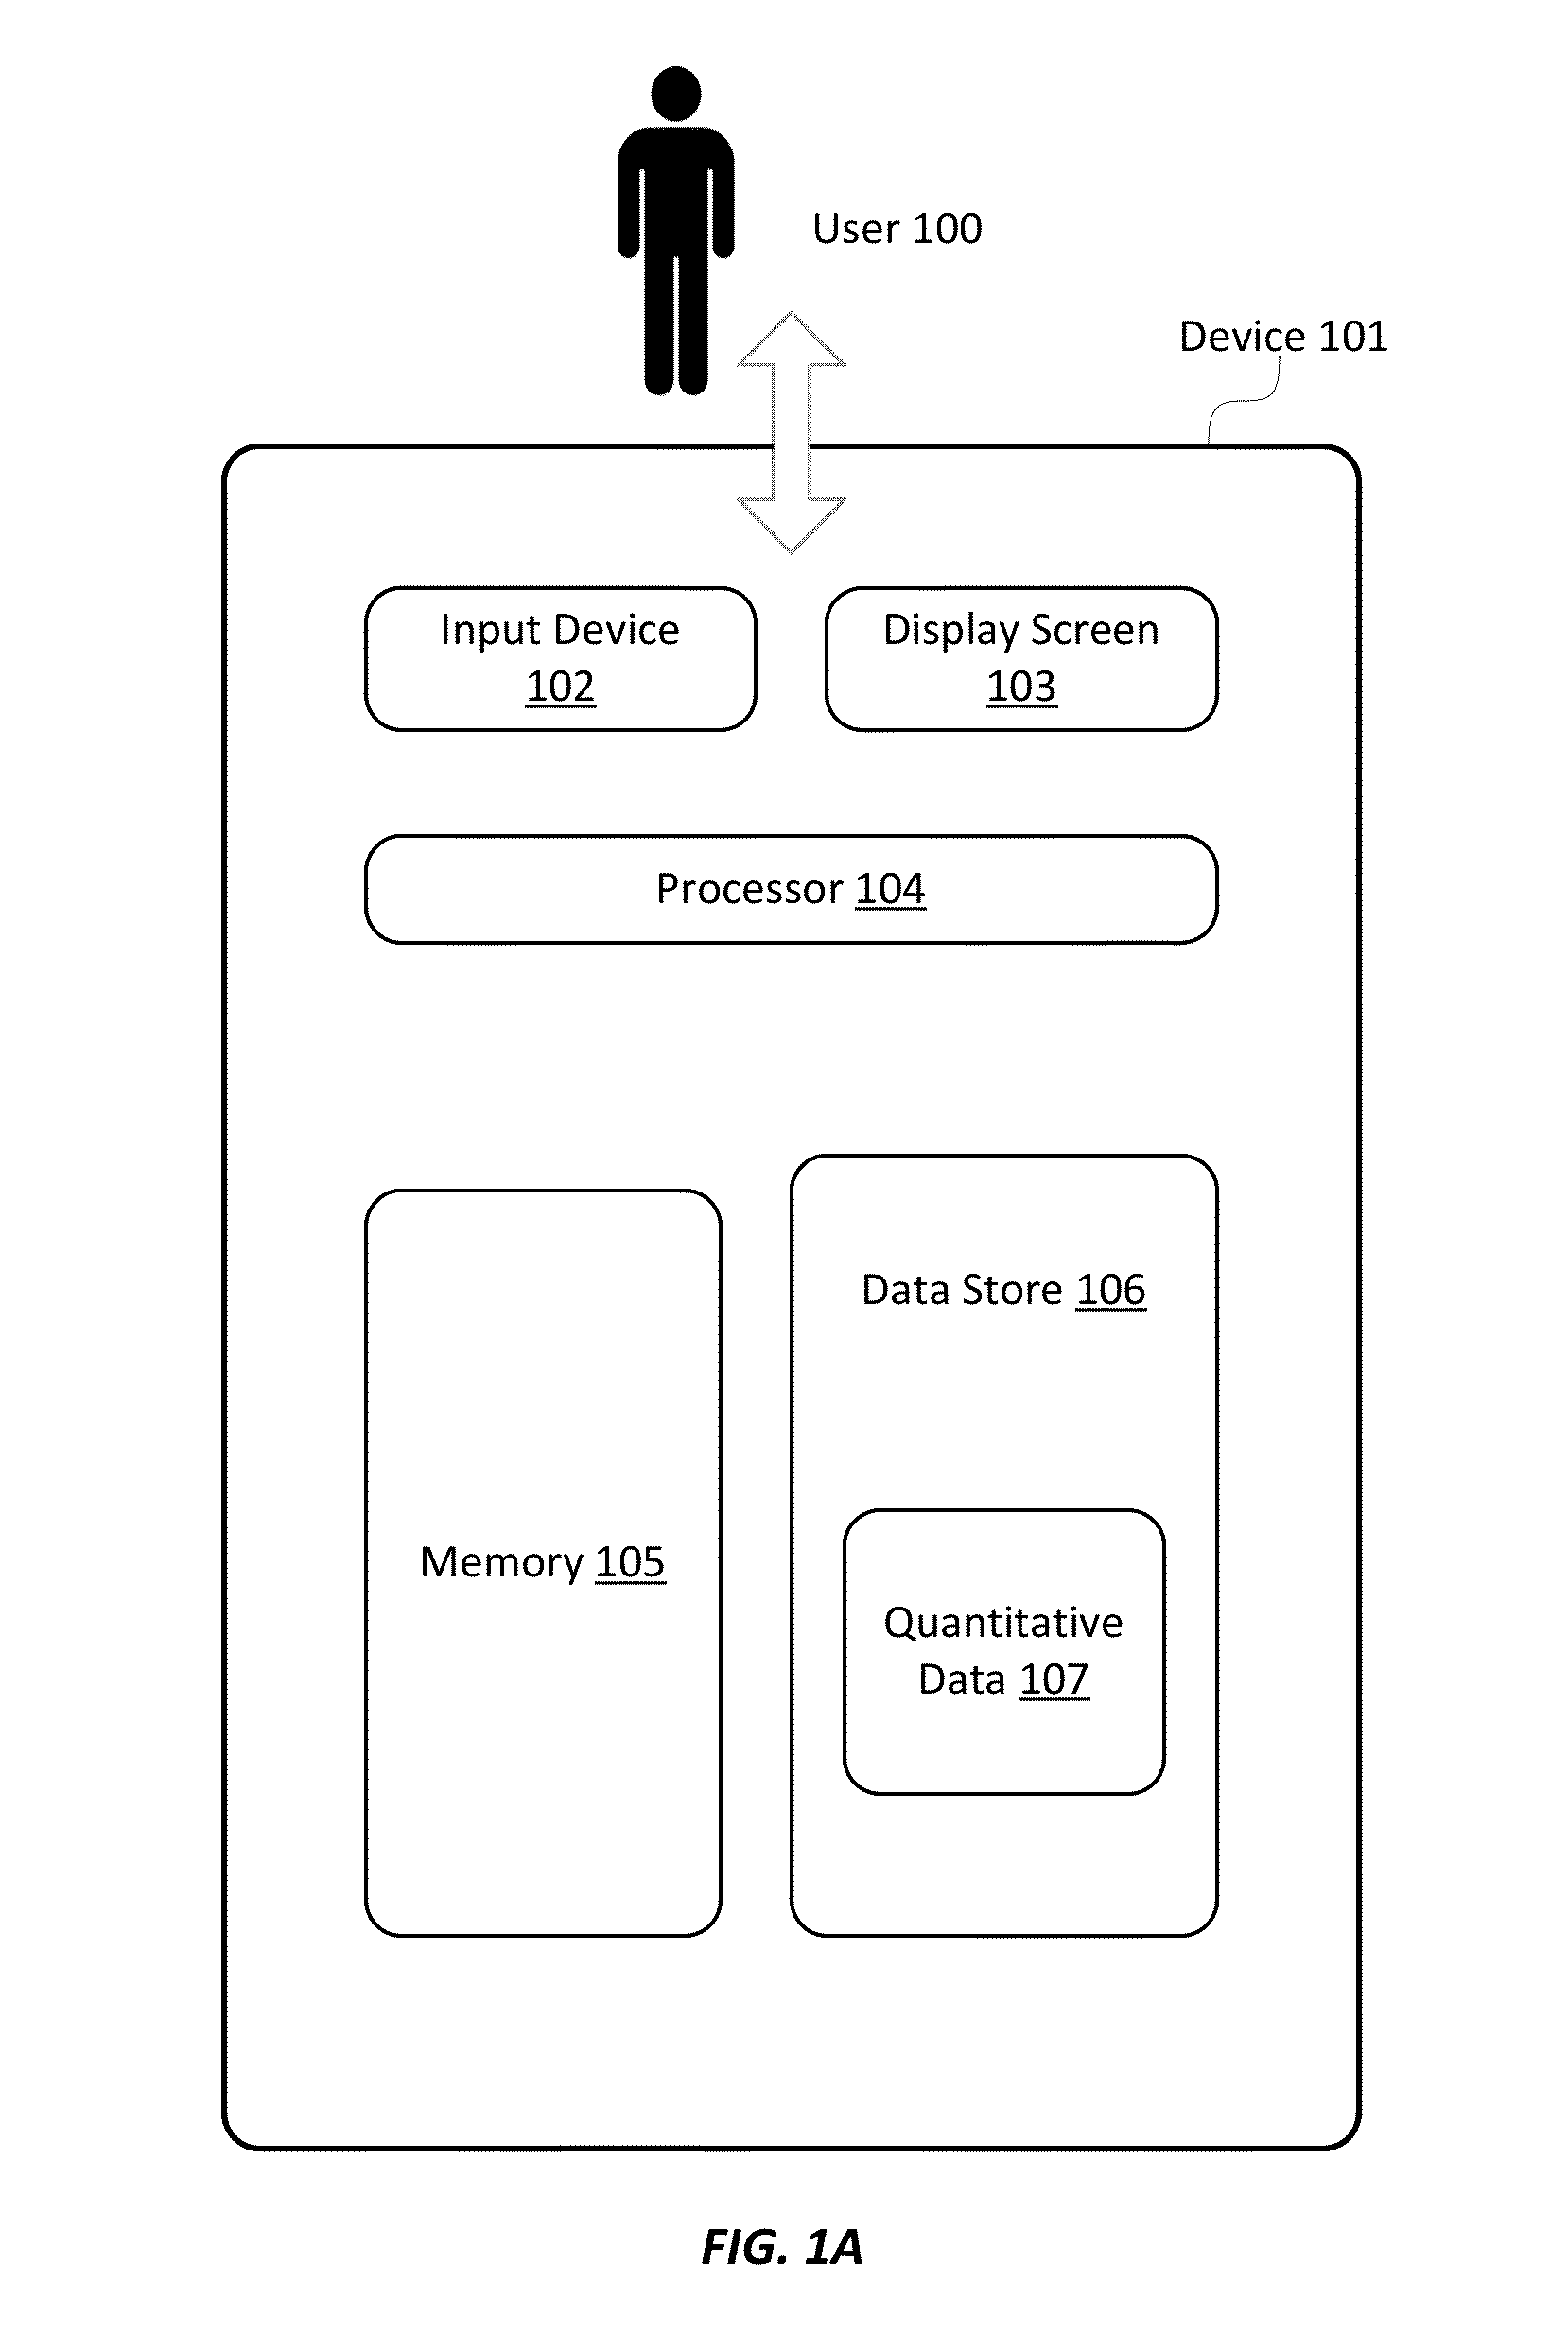
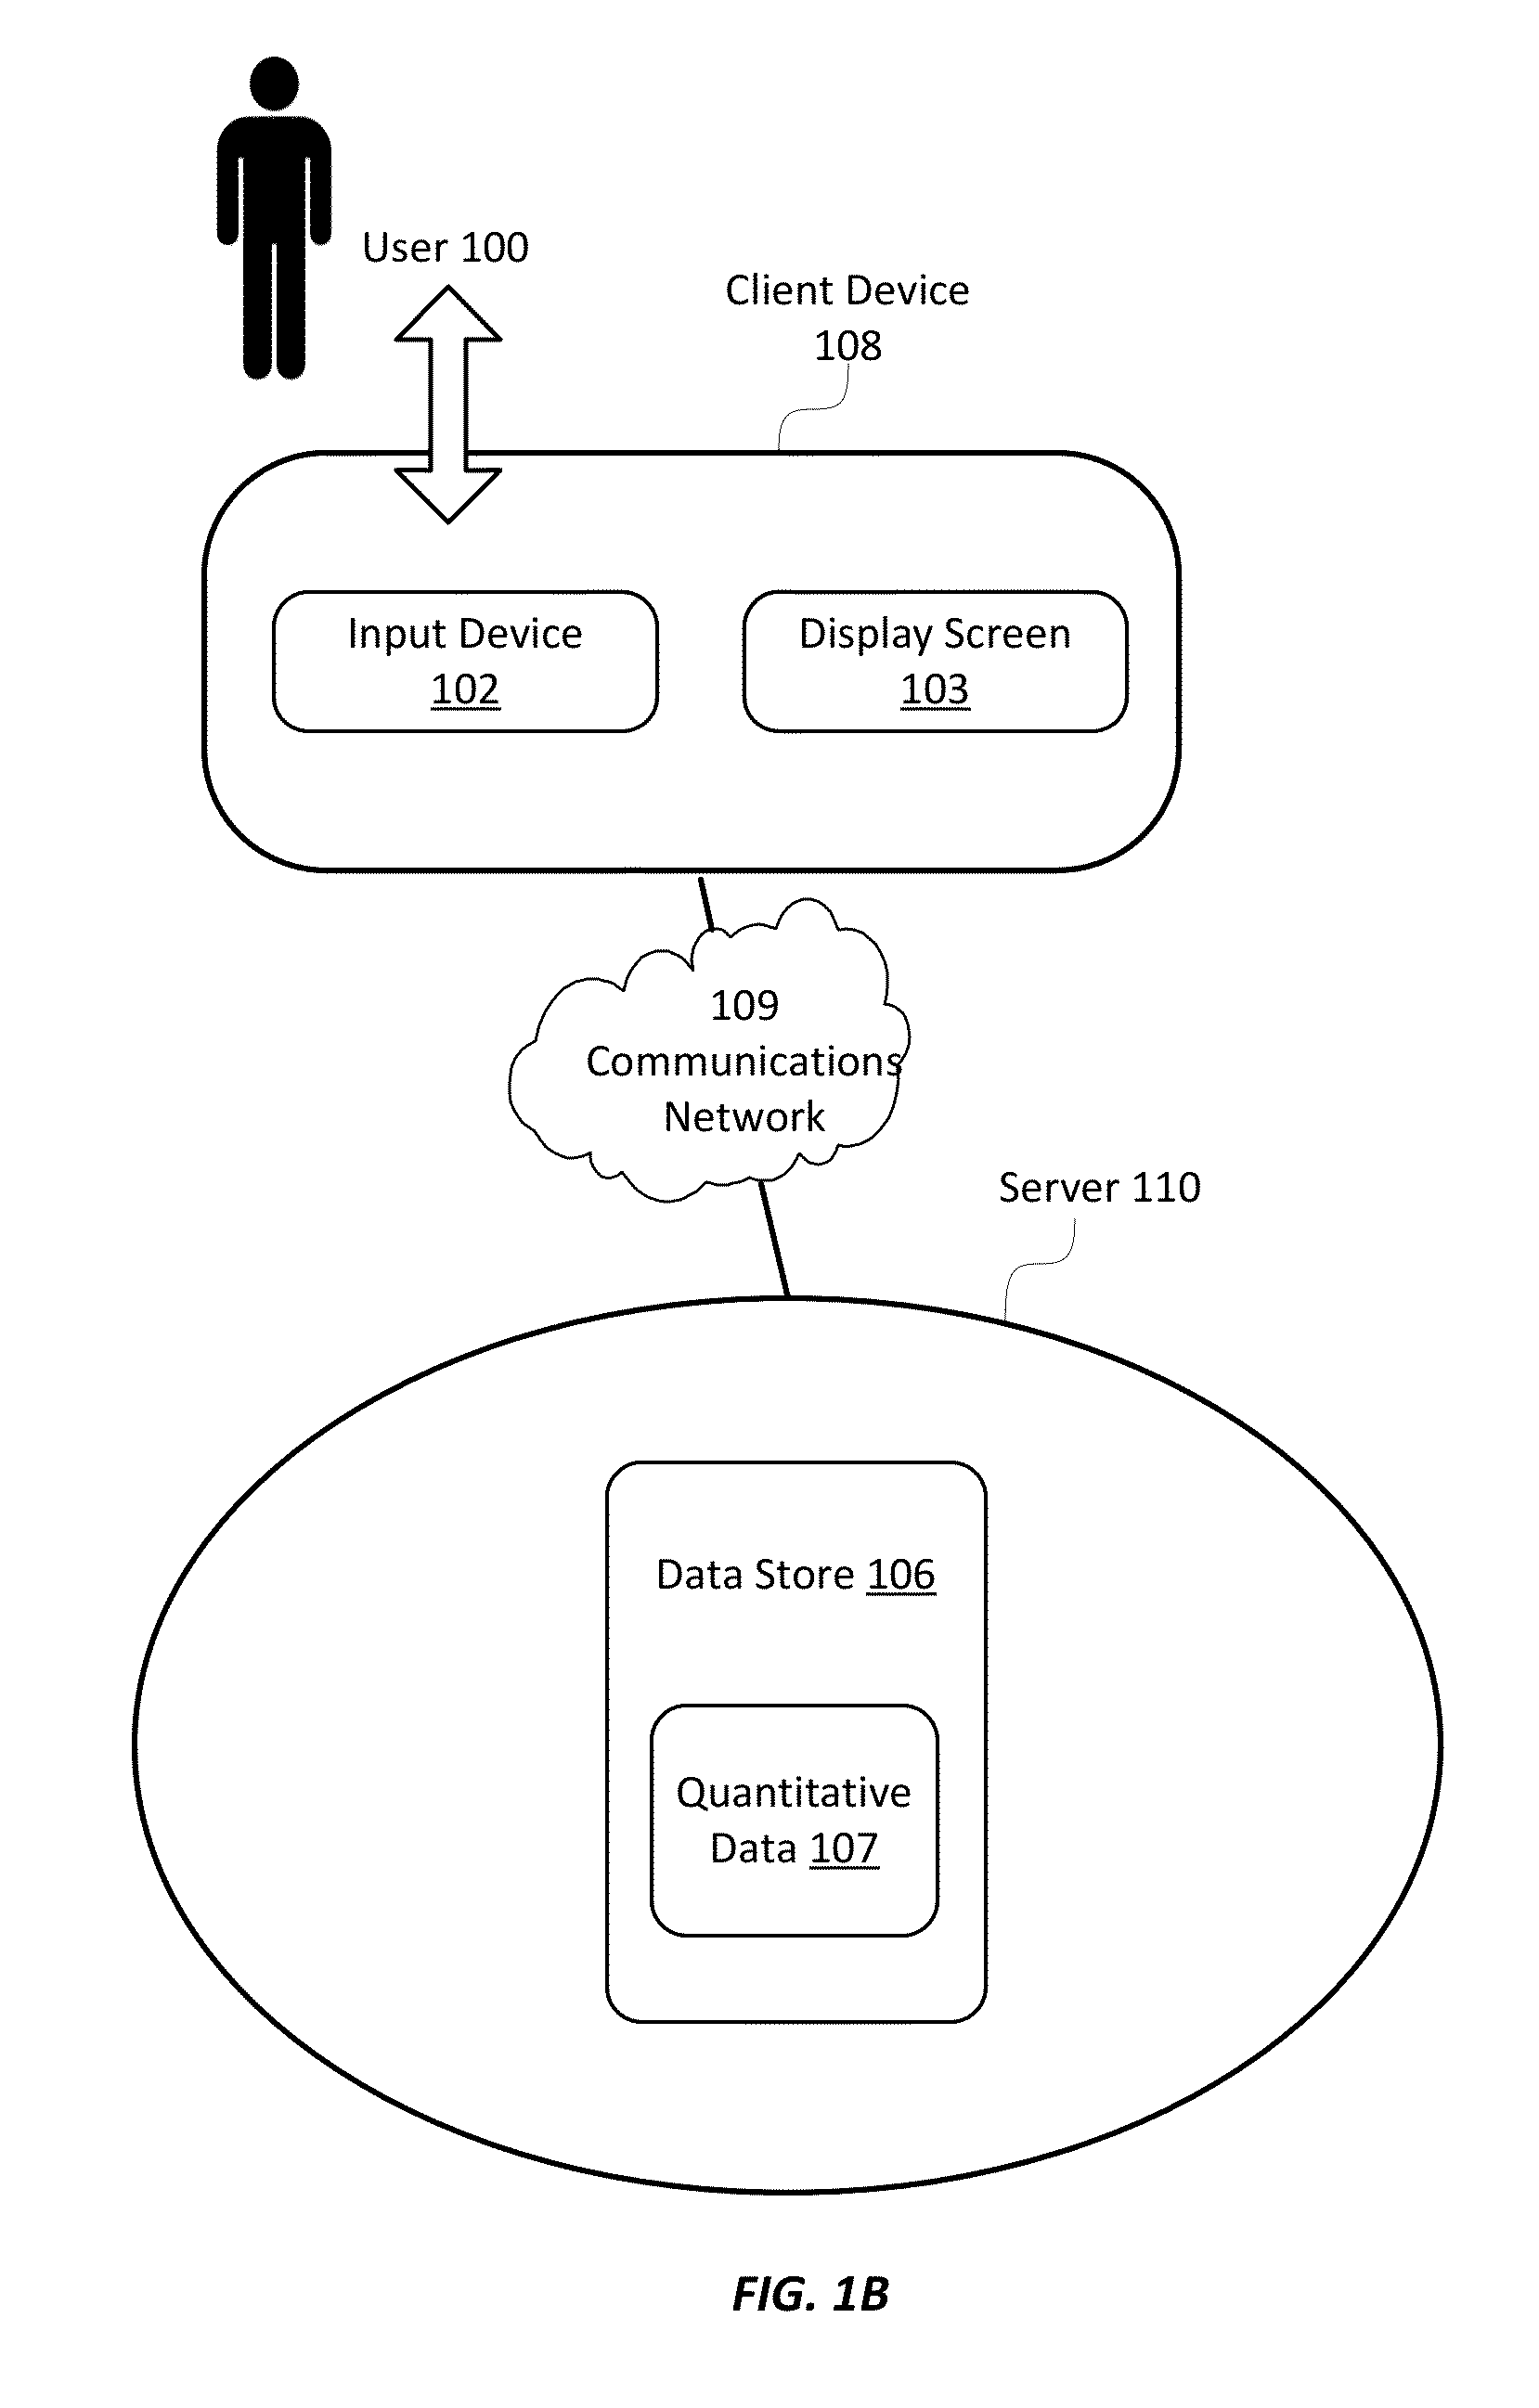
[0020]According to various embodiments, the present invention can be implemented on any electronic device equipped to receive, store, and present quantitative data. Such an electronic device may be, for example, a desktop computer, laptop computer, smartphone, tablet computer, or the like.

[0021]Although the invention is described herein in connection with an implementation in a computer, one skilled in the art will recognize that the techniques of the present invention can be implemented in other contexts, and indeed in any suitable device capable of presenting quantitative data graphically and / or interactively. Accordingly, the following description is intended to illustrate various embodiments of the invention by way of example, rather than to limit the scope of the claimed invention.

[0022]Referring now to FIG. 1A, there is shown a block diagram depicting a hardware architecture for practicing the present invention, according to one embodiment. Such an architect...


PUM


Abstract

A user can dynamically invoke and control the display of secondary data visualizations based on a selected element of a primary data visualization. Previews of the secondary data visualizations are presented as the user interacts with the primary visualization. In response to user input, previews can be dynamically expanded, allowing a user to dynamically “drill down” into selected elements of the primary data visualization. Any suitable input mechanism can be used, including for example, a gesture such as a two-finger spreading motion to invoke previews of available secondary visualizations, wherein the axis defined by two points of contact determines which of the displayed previews of secondary visualizations is highlighted and / or expanded. In various embodiments, a hierarchy of visualizations can be established, and the user can navigate among two or more levels of visualizations in the same interactive manner.

Description

CROSS-REFERENCE TO RELATED APPLICATION[0001]The present application claims priority from U.S. Provisional Application Ser. No. 61 / 506,912 for “Drill by Expansion,” filed Jul. 12, 2011, which is incorporated herein by reference.FIELD OF THE INVENTION[0002]The present invention relates to interactive graphical displays of data visualizations representing quantitative data.DESCRIPTION OF THE RELATED ART[0003]Electronic devices—such as desktop, laptop, and tablet computers, as well as mobile devices such as smartphones—are often capable of storing and displaying various forms of data visualizations (or “reports”) representing quantitative data. Data visualizations can represent any information, such as financial information, marketing information, and / or the like, in any suitable tabular, text-based, and / or graphical format.[0004]It is known in the art to provide interactivity for data visualizations. In many computing environments, including web-based applications such as browsers for ...

Claims


Application Information

Patent Timeline
Patent Type & Authority Patents(United States)
IPC IPC(8): G09G5/00G06T11/60G06T11/00G06T19/00
CPCG06T11/60G06T11/00G06T19/00G06T11/206G06F3/04845G06F3/04883G06F3/0482G06F3/04842G06F2203/04808
Inventor WINTERS, ALANRAUBVOGEL, AMIR H.
Owner DOMO
Why Eureka
Try Eureka