

Clinical diagnostic system including instrument and cartridge
a diagnostic system and cartridge technology, applied in the field of health care, can solve problems such as inaccurate diagnoses, and achieve the effects of compact scale, accurate and precise, and ease of use with fail-safe mechanisms
- Summary
- Abstract
- Description
- Claims
- Application Information
AI Technical Summary
Benefits of technology
Problems solved by technology
Method used
Image

Examples
example 1
Computing the Volume of a Liquid
[0495]FIG. 29 illustrates a typical output from a system monitoring the fluidic channel where a volume of liquid is passed. In FIG. 29, the horizontal axis is time (each data point is 10 milliseconds (ms)) and the vertical axis is the analog sensor output in volts. There is a 130 mV difference between the high (representing AIR in the system) and the low (representing LIQUID) in the system. There is a 110 mV difference between the low (representing LIQUID) and the high (after data point 342, representing WET). The noise level on the signal is about 47 mV, which is low enough to enable clear distinction of air and liquid in the channels.
[0496]A sensor output was used to compute the volume of the liquid, by computing the time that the liquid was present and multiplying by the pump's flow rate during the fluid motion. Also, the fact that there were no interruptions in the “low” signal (e.g., remains low, does not go up to the 0.6 V level) indicated that ...
example 2
Detecting Leaks in a Fluidic System
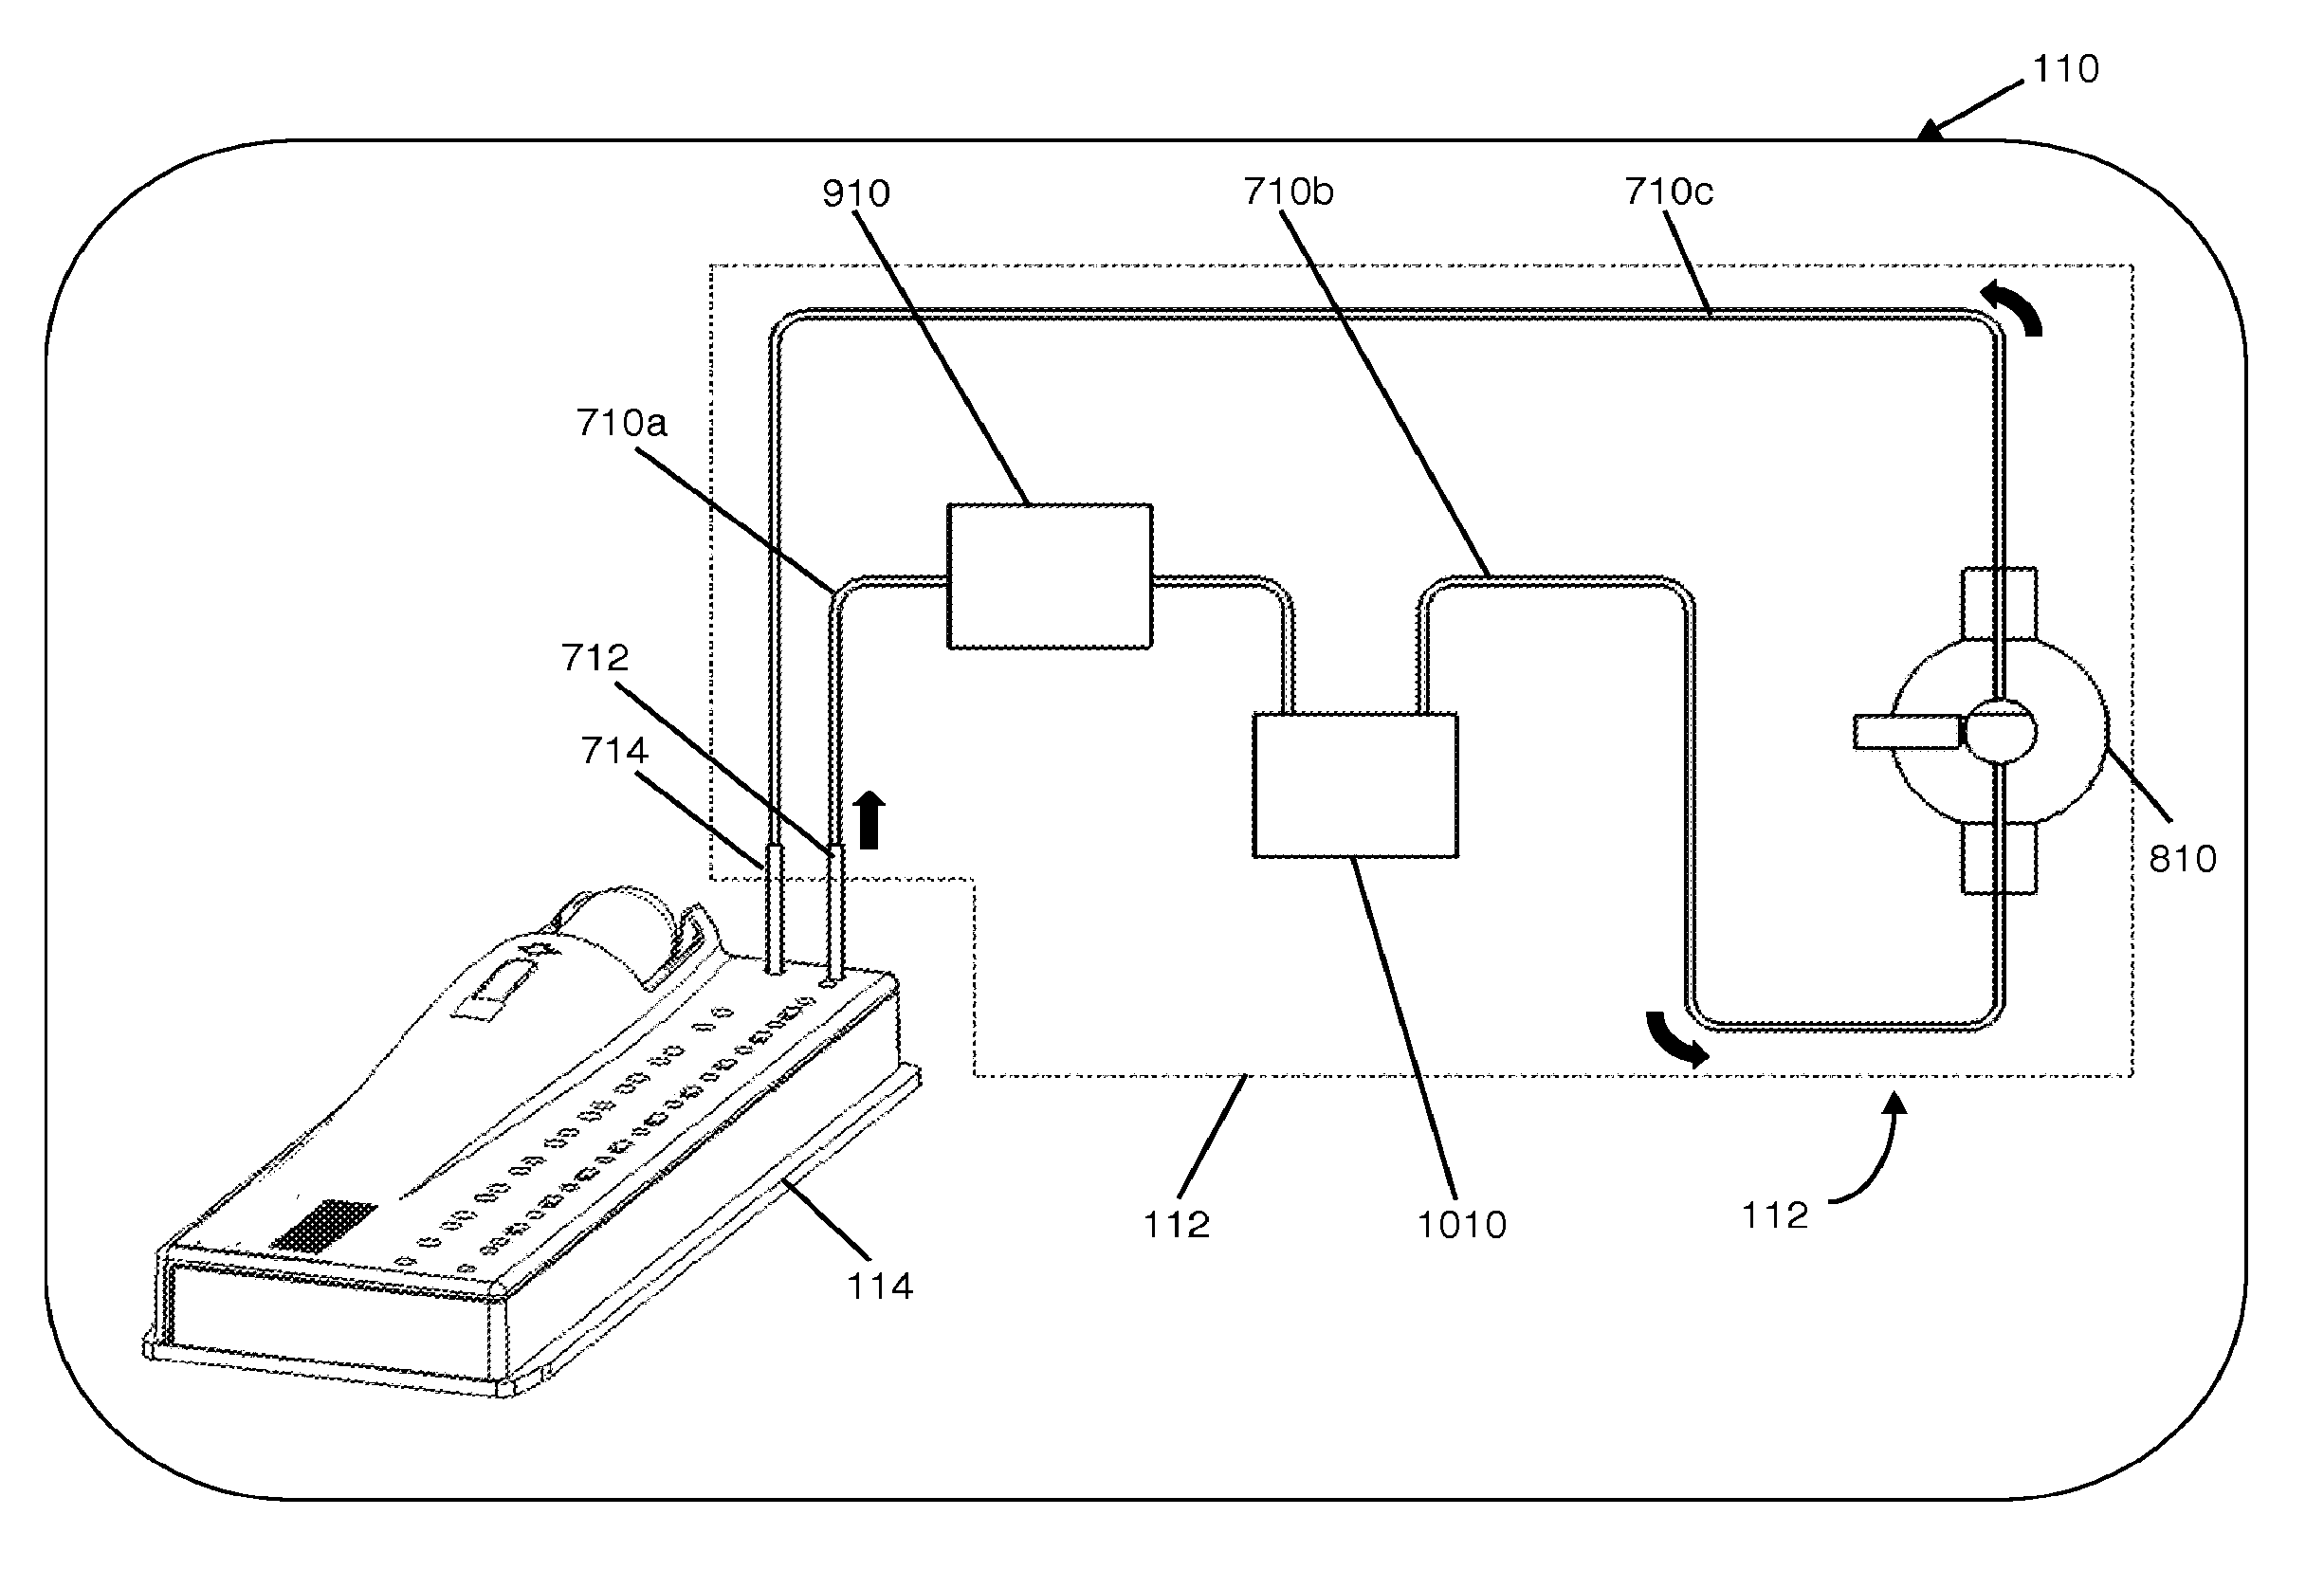
[0497]FIG. 30A illustrates an example of a sequence of operations to detect leaks in the fluidic system. On a disposable cartridge where the patient sample was divided into aliquots of equal amounts each was processed independently in a multiple test cartridge (a cartridge that can run multiple tests with the same patient's sample). Sample Vs was aspirated into the channel, via the probe at the probe entry site 716. The sample volume was aspirated through a probe at the probe entry site 716 sealed to a septum 350, into the desired channel. The software reset a timer (T0) and commanded the pump to aspirate at a fixed flow rate (Fr) while monitoring the optical sensor's output until an air to liquid boundary was detected (FIG. 30B), as soon as it was detected the firmware made a copy of the current timer (T1).
[0498]The pump continued aspirating the sample, and as soon as a liquid to air transition was detected, the software made the copy of the timer...
example 3
Detecting Cartridges Stored at Different Temperatures and Applying Different Incubation Set Temperatures for Cartridges Stored at Different Temperatures
[0502]Cartridges stored at two different temperatures were differentiated by monitoring the temperature at a temperature sensor and evaluating the temperature loss over the first 30 seconds of cartridge processing. FIG. 47 is a graphical representation of the temperature monitored at a temperature sensor for two different cartridges stored at two different temperatures. When cartridges at two different storage conditions are detected, the instrument can apply different parameter values for the incubation.
[0503]Table 4 below shows a scenario when different incubation set temperatures were applied for the cartridges stored at two different storage temperatures. Table 4 below shows the set temperatures used for this example.
[0504]
TABLE 4Incubation Temperature Set PointsTest No.For 15° C. CartridgeFor 32° C. CartridgeA40.5° C.40.5° C.B40...
PUM
 Abstract
Description
Claims
Application Information