Diagnostic marker for diabetic vascular complications
A technology for complications and diabetes, which is applied in the field of diagnostic markers for diabetic vascular complications, and can solve problems such as accelerated vascular damage
- Summary
- Abstract
- Description
- Claims
- Application Information
AI Technical Summary
Problems solved by technology
Method used
Image
Examples
Embodiment 1
[0035] Example 1: Research Methods
[0036] This study used the following methods:
[0037] research group
[0038] The study population was the North American DCCT / EDIC study group, consisting of 1325 patients with type 1 diabetes among the original 1441 DCCT subjects. The original DCCT (Diabetes Control and Complications Trial, Diabetes Control and Complications Trial) study group consisted of men and women aged 13-40, who joined the study between 1983-1989 and had a history of diabetes for 1-15 years when they joined the study (The Diabetes Control and Complications Trial Research Group (1993) N Engl J Med 329:977-986). Half the patient population was randomly assigned to receive usual diabetes care and the other half to receive intensive diabetes care. In 1993, after an average follow-up period of 6.5 years, the DCCT study was stopped after intensive treatment clearly showed that the risk of retinopathy, nephropathy and neuropathy could be reduced (The Diabetes Control ...
Embodiment 2
[0048] Example 2: CTGF N Fragment Levels in the DCCT / EDIC Study Group of Type 1 Diabetes Patients
[0049] The clinical characteristics of the study population for which CTGF measurements were performed are listed in Table 1 (Clinical Characteristics of the DCCT / EDIC Study Group by Sex * ). The plasma levels of CTGF N fragments and the urinary excretion rate of CTGF N fragments were measured in 1052 patients with type 1 diabetes mellitus. The relationship between the logarithm of CTGF N-fragment and biochemical parameters in the study group of patients is listed in Table 2 (univariate regression analysis was performed to predict the logarithm of CTGF N-fragment level). The univariate regression coefficients in Table 2 can be interpreted as the log mean change in CTGF N fragment per unit change for a given covariate. Another explanation is that exp(β) is approximately equal to the relative increase in CTGF N fragment per unit change in covariate.
[0050] Table 1
[0051] ...
Embodiment 3
[0057] Example 3: Correlation between plasma CTGF N fragments and blood pressure
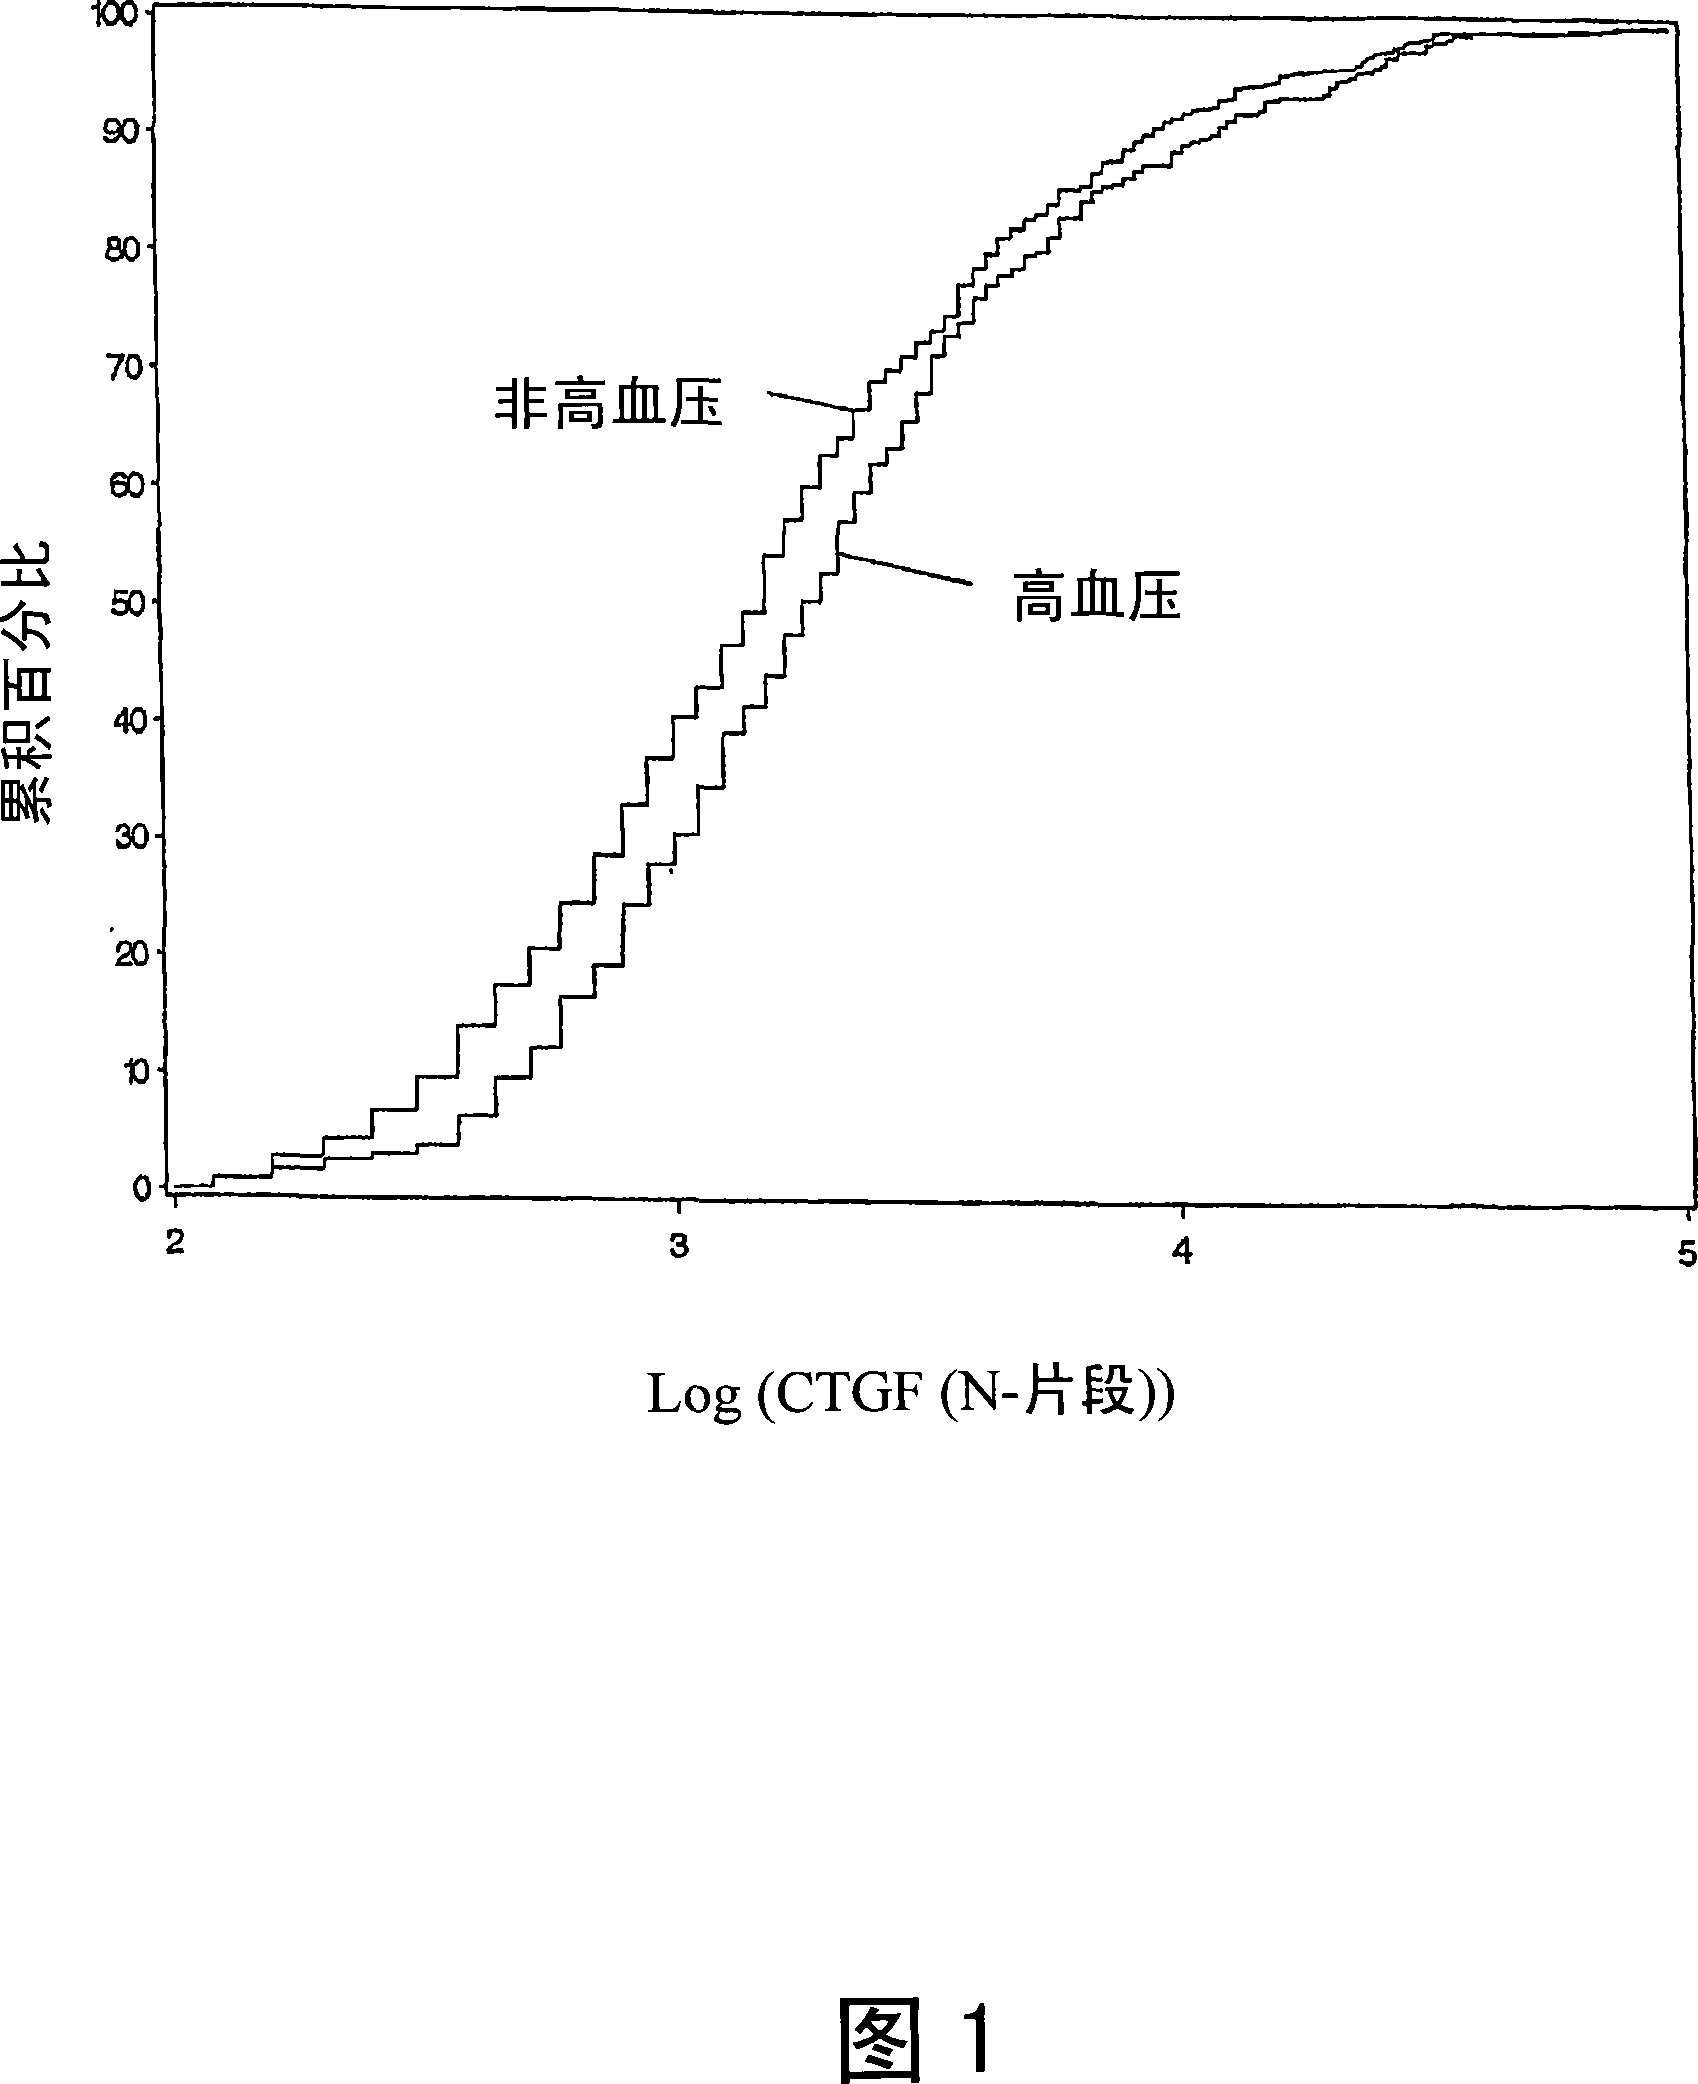
[0058] The results in Figure 1 show non-hypertensive (n = 668) and hypertensive (n = 382) patients (all patients were diagnosed with hypertension, systolic blood pressure > 140, diastolic blood pressure > 90; and treated with antihypertensive drugs) Estimated cumulative distribution of the logarithm of plasma CTGF N fragments. These results demonstrate that hypertensive subjects tend to have higher plasma CTGF N fragment log values than normotensive subjects.
[0059] The mean logarithm of plasma CTGF N-fragment in patients with proven hypertension was significantly higher than that in patients without hypertension (3.36±0.04 ng / ml in the former versus 3.21±0.03 ng / ml in the latter, P=0.0005). The actual mean plasma CTGF level measured in hypertensive patients was 41.57±3.47 ng / ml, while the actual mean plasma CTGF level measured in normotensive patients was 32.28±1.81 ng / ml, P=0.0109. There...
PUM
| Property | Measurement | Unit |
|---|---|---|
| molecular weight | aaaaa | aaaaa |
Abstract
Description
Claims
Application Information
 - R&D
- Intellectual Property
- Life Sciences
- Materials
- Tech Scout
- Unparalleled Data Quality
- Higher Quality Content
- 60% Fewer Hallucinations
Browse by: Latest US Patents, China's latest patents, Technical Efficacy Thesaurus, Application Domain, Technology Topic, Popular Technical Reports.
© 2025 PatSnap. All rights reserved.Legal|Privacy policy|Modern Slavery Act Transparency Statement|Sitemap|About US| Contact US: help@patsnap.com

