Large-scale network topology plane visualization method based on vector diagram and bitmap
A technology of network topology and vector graphics, applied in data exchange networks, digital transmission systems, electrical components, etc., can solve problems such as slow refresh speed and complex algorithms
- Summary
- Abstract
- Description
- Claims
- Application Information
AI Technical Summary
Problems solved by technology
Method used
Image
Examples
specific Embodiment approach 1
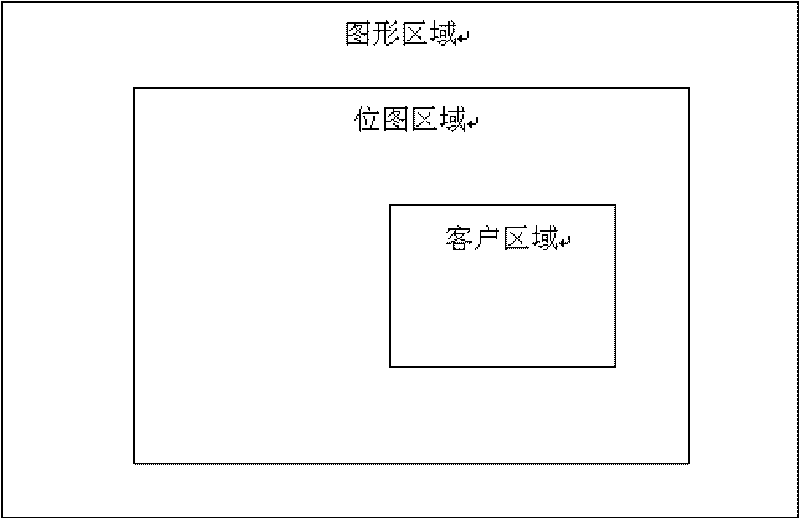
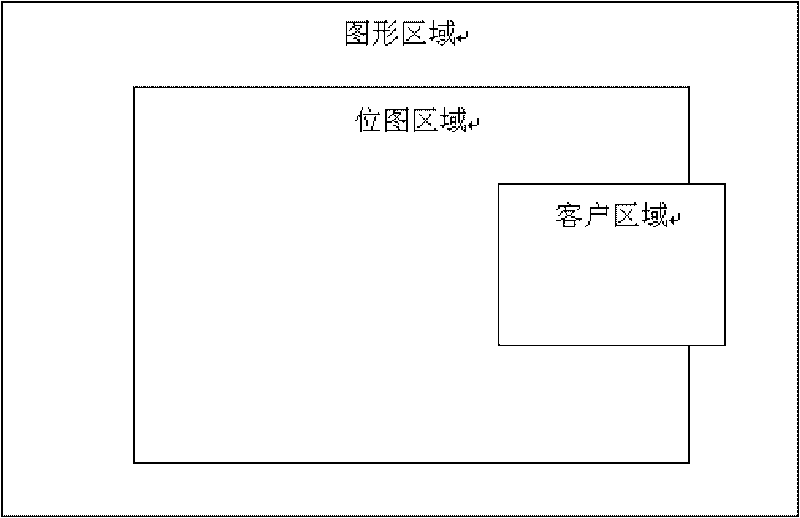
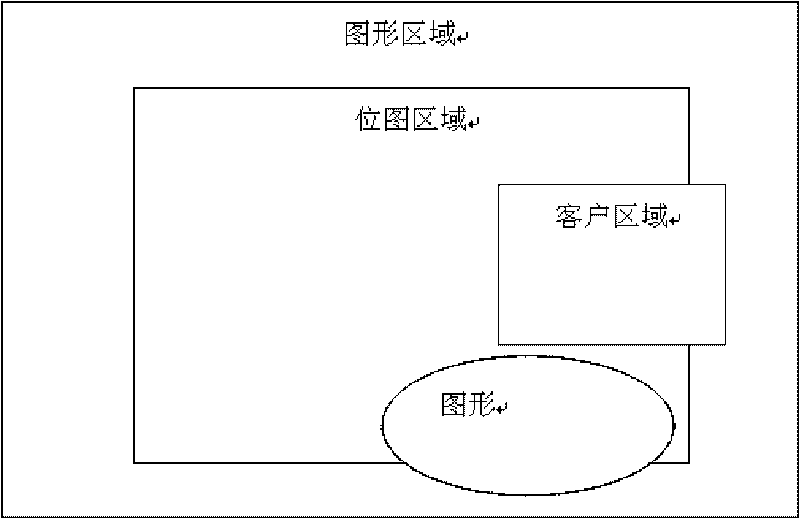
[0044] Specific implementation mode 1: The large-scale network topology plane visualization method based on vector diagrams and bitmaps described in this implementation mode uses bitmaps of three layers to display the network topology map, and the first layer is represented by a blank bitmap the graphics area; the second layer on the graphics area is a bitmap area with coordinates, which is used to record a part of the graphics; the third layer on the bitmap area is the client area, that is, the user's the area that can be seen;
[0045]Use the position, curve and color of the nodes saved in the vector graphics file; and map the vector graphics to the bitmap area;
[0046] When the client area moves within the bitmap area, the visualization process is:
[0047] Y1. Calculate the horizontal and vertical coordinate offsets of the movement of the client area;
[0048] Y2. Calculate the size of the client area;
[0049] Y3. Determine the target location of the customer area mov...
specific Embodiment approach 2
[0063] Specific implementation mode two: this implementation mode is a specific embodiment of the large-scale network topology plane visualization method based on vector graphics and bitmaps described in specific implementation mode one:
[0064] The bitmaps of the three layers in the present embodiment are used to display the topological map, the size of the blank bitmap of the first layer is 10000 * 10000 pixel graphics area, and the coordinate area of the bitmap area of the second layer is (-32767, -32767)~(32767, 32767), see figure 1 shown.
[0065] Use the position, curve and color of the nodes saved in the vector graphics file; map the vector graphics to the bitmap area.
[0066] The client area is the graphic range that can be seen on the screen, that is, the client area only records a part of the entire topological graph. When the user drags to observe the client area, that is, the partial graphic, It is necessary to recalculate to generate the vector image, beca...
PUM
 Abstract
Description
Claims
Application Information
 - R&D
- Intellectual Property
- Life Sciences
- Materials
- Tech Scout
- Unparalleled Data Quality
- Higher Quality Content
- 60% Fewer Hallucinations
Browse by: Latest US Patents, China's latest patents, Technical Efficacy Thesaurus, Application Domain, Technology Topic, Popular Technical Reports.
© 2025 PatSnap. All rights reserved.Legal|Privacy policy|Modern Slavery Act Transparency Statement|Sitemap|About US| Contact US: help@patsnap.com


