Visualization plotting method and system based on geographic information system

A geographic information system and plotting technology, applied in the field of image visualization, can solve problems such as inability to display maps, inability to dynamically display plotted graphics, etc.

Active Publication Date: 2012-05-23
CHINA TELECOM CORP LTD
View PDF3 Cites 12 Cited by
  • Summary
  • Abstract
  • Description
  • Claims
  • Application Information

AI Technical Summary

Problems solved by technology

In addition, when roaming is performed on the plotted map, such as image 3 As shown in , it can be found that the plotting graphics are still the size ratio of the initial drawing, and always remain at the screen position at the time of initial drawing, and cannot be displayed at the corresponding

Method used


Image

  • Visualization plotting method and system based on geographic information system
  • Visualization plotting method and system based on geographic information system
  • Visualization plotting method and system based on geographic information system

Examples


Embodiment Construction

[0035] The technical solutions of the present invention will be described in further detail below with reference to the accompanying drawings and embodiments.

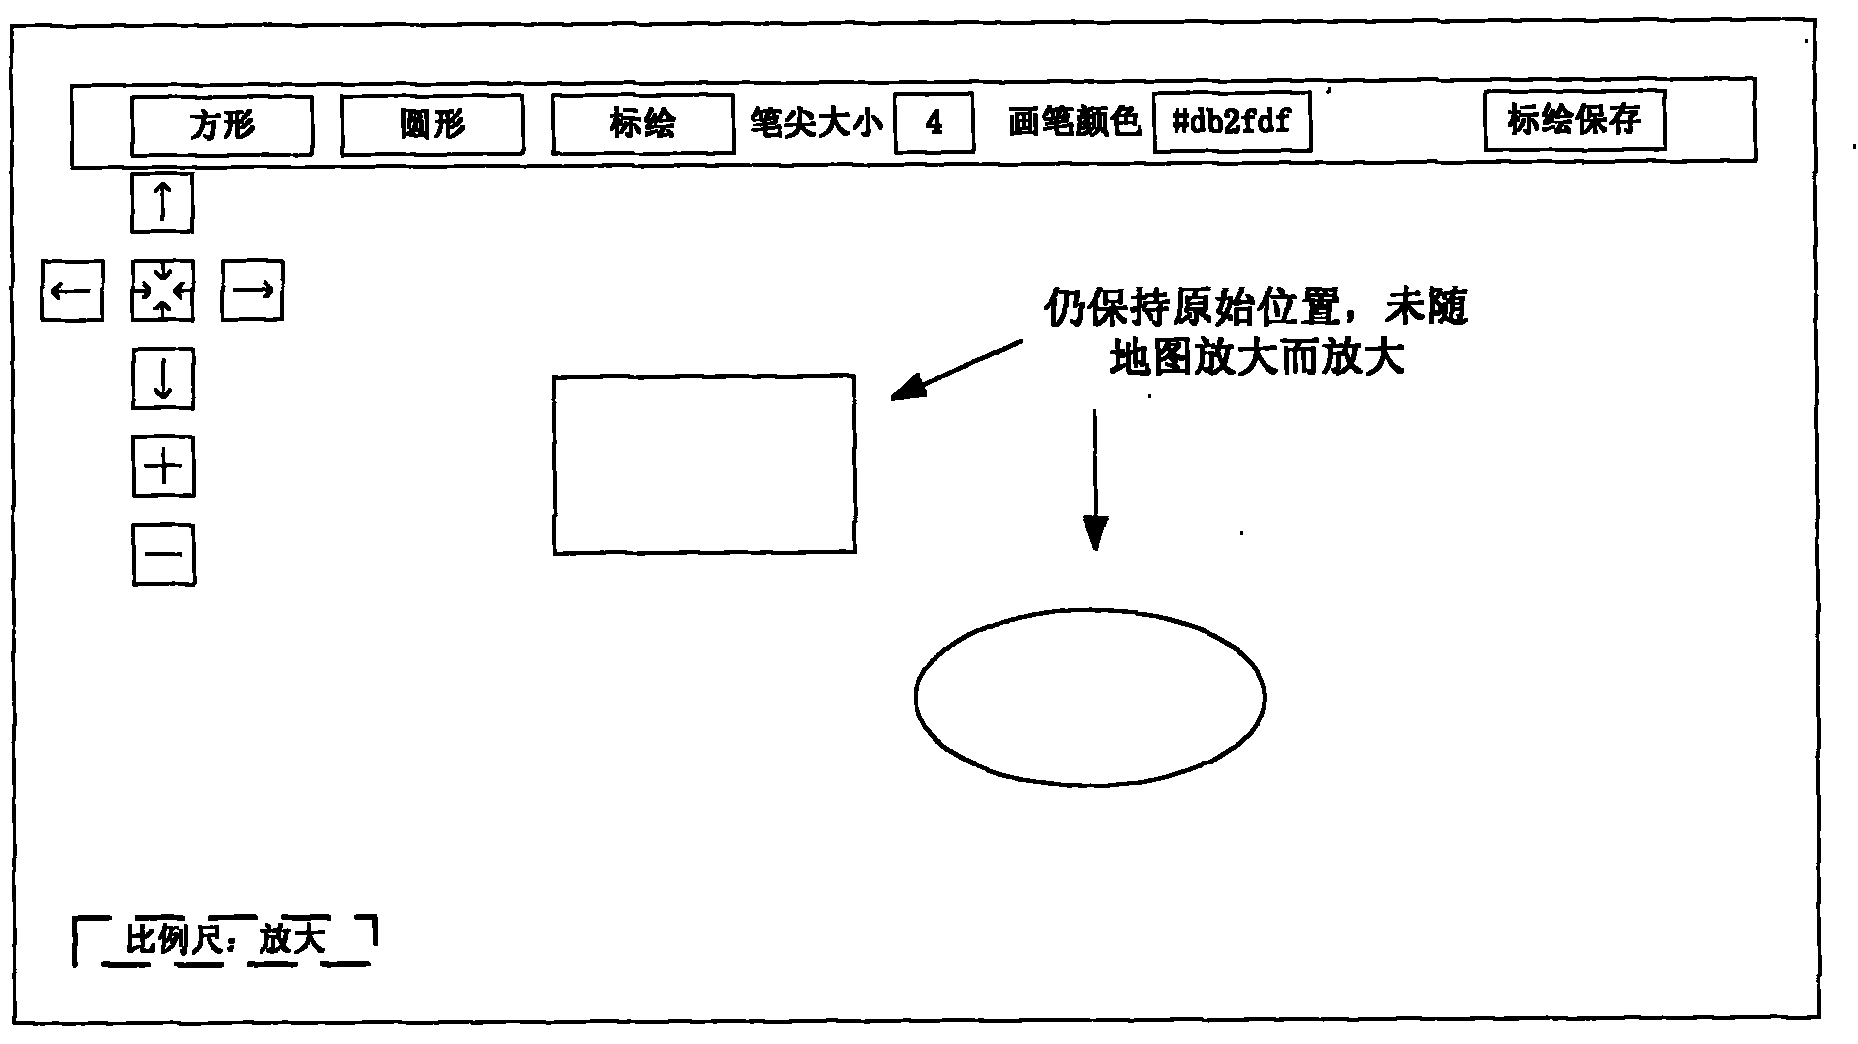
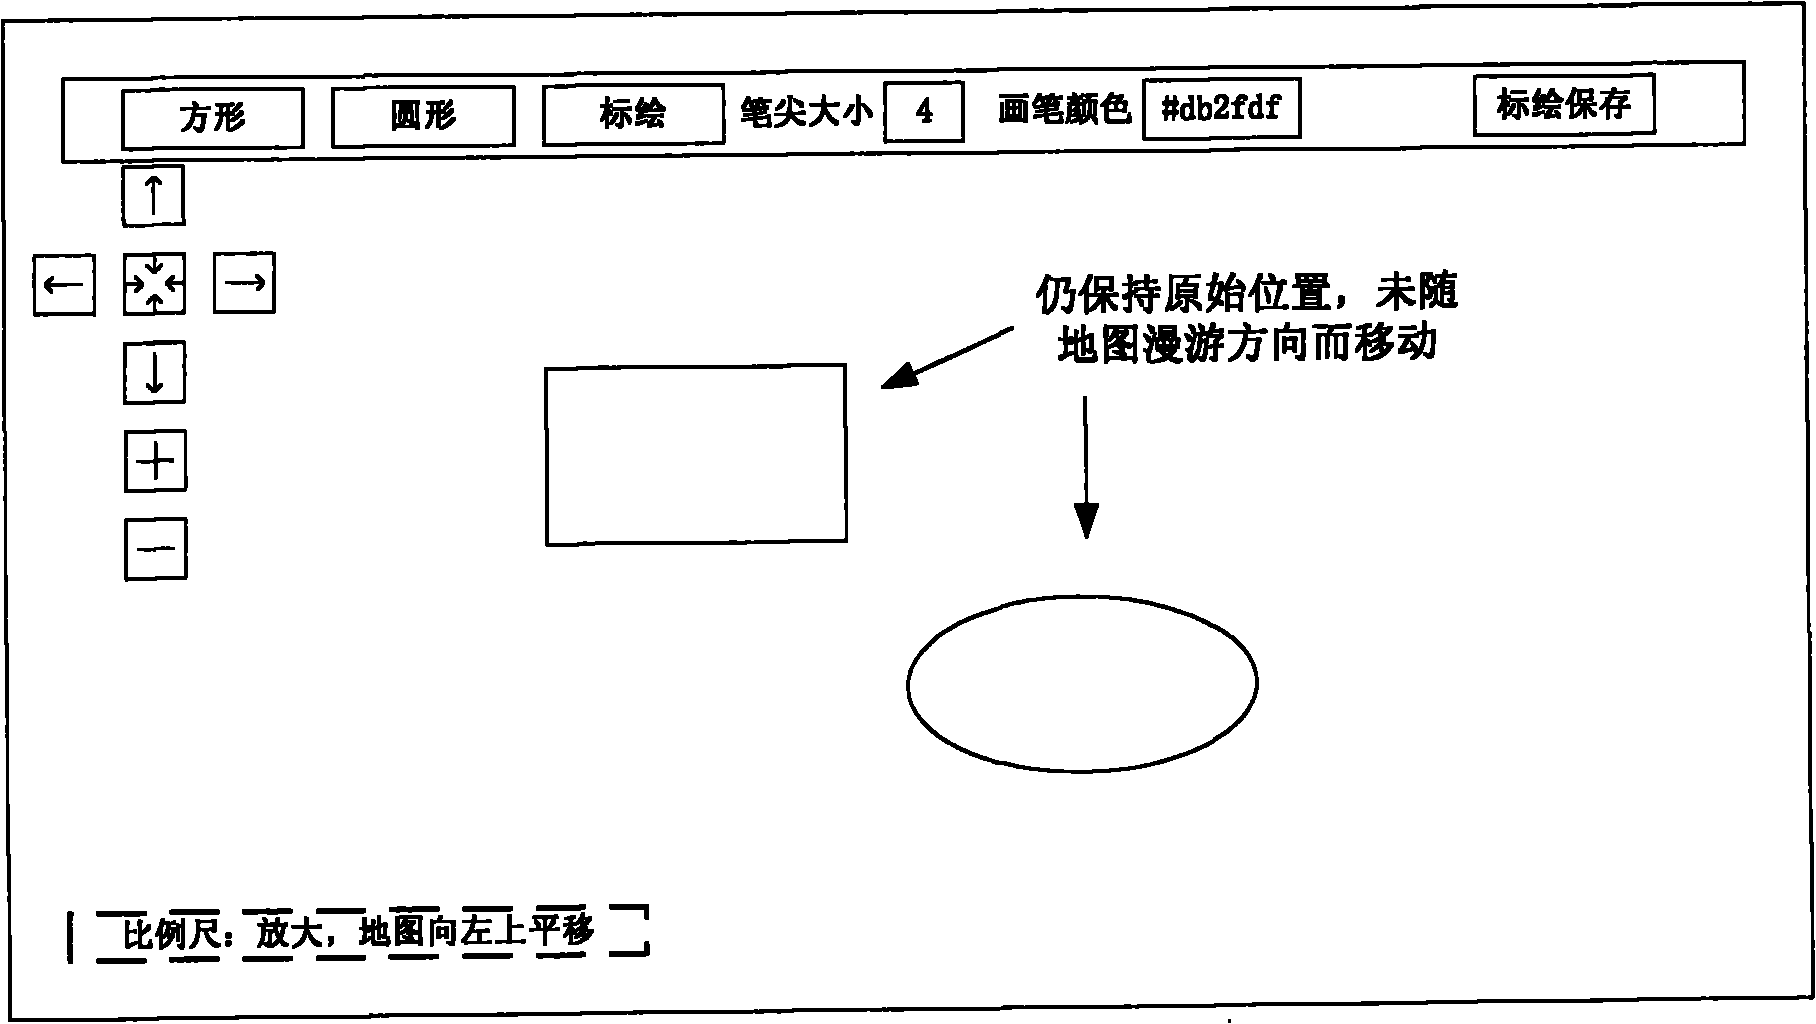
[0036] First introduce VML. The full name of VML is Vector Markup Language (Vector Markup Language). Vector graphics means that the graphics can be arbitrarily enlarged and reduced without losing the quality of the graphics, which is very useful in making maps. VML is equivalent to the brush in IE, which can realize the graphics you want, and combined with scripts, it can make the graphics produce dynamic effects.

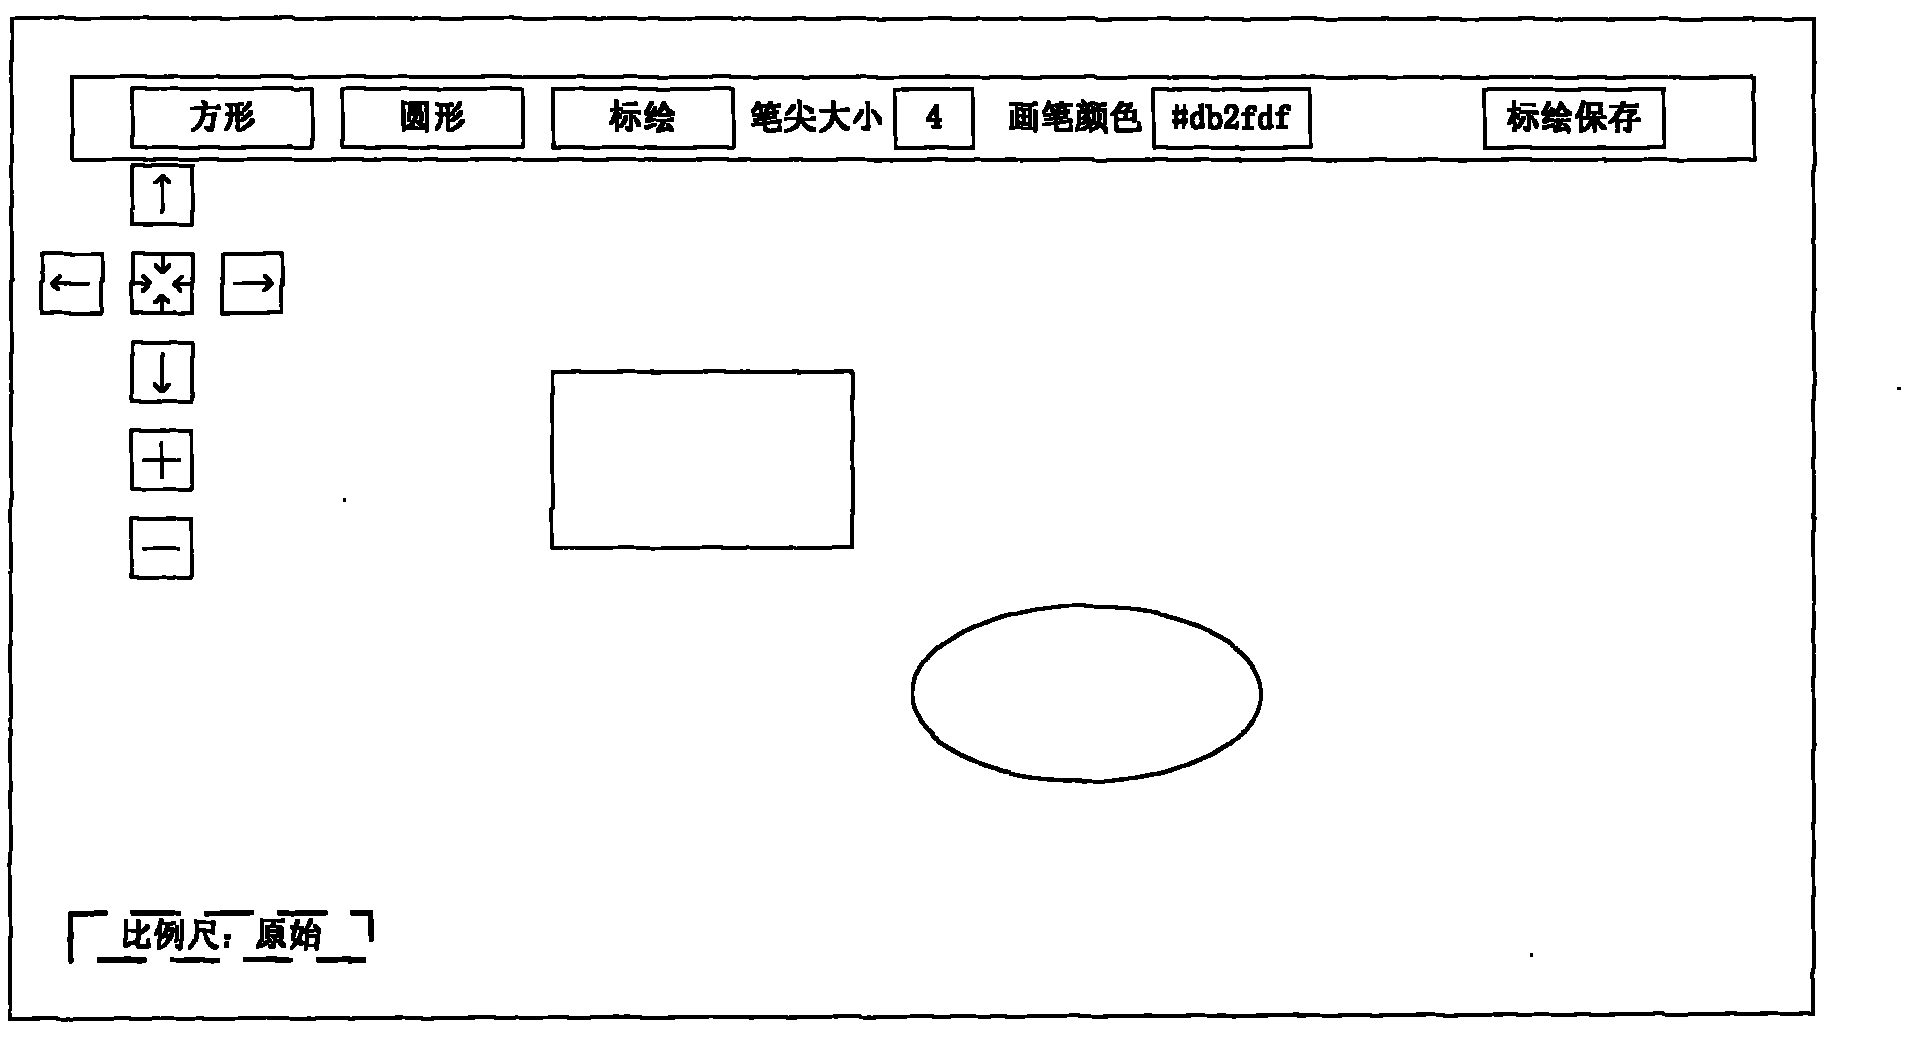
[0037] The GIS plotting framework in the present invention has three layers, which are map (MAP) layer, frame (IFRAME) layer, and block (DIV) layer in order of priority from low to high. The MAP layer is the lowest hierarchical structure used to display the map module, that is, to display the display related to the map. The IFRAME layer is a sub-level structure for temporarily storing VML plotting data, ...


PUM


Abstract

The invention relates to a visualization plotting method based on a geographic information system (GIS). The visualization plotting method comprises the steps of: obtaining all currently-plotted VML (Vector Markup Language) statements; processing the VML statements, converting screen coordinates of plotted patterns corresponding to the VML statements into map geographic coordinates; reconstructing the VML statements to form and associate as well as store map-visualization VML statements, and replacing the screen coordinates with the map geographic coordinates; when a reference position and/or screen plotting scale of a map changes, extracting all map-visualization VML statements associated with a selected VML identifier, extracting the map geographic coordinates of the map-visualization VML statements, and converting a map geographic position into new screen coordinates; reconstructing the map-visualization VML statements to form new VML statements, replacing the map geographic coordinates in the new VML statements with the screen coordinates; and executing the new VML statements to display a corresponding plotted pattern. Through conversion and associating-storage of the VML statements, the invention ensures that the proper plotted patterns can be dynamically shown with the change of the map when the map is subjected to various operations.

Description

technical field [0001] The present invention relates to the field of image visualization, in particular to a visual plotting method and system based on a Geographic Information System (GIS for short). Background technique [0002] With the rapid development of China's economy, more and more populations are gathered in economically developed cities. To maintain the prosperity and stability of these metropolises, relevant departments shoulder important responsibilities. Especially in modern big cities with high population mobility and complex social and environmental structures, it is extremely important whether various emergency problems can be properly and quickly resolved. [0003] Among related system software, GIS system has been more and more widely used because of its powerful spatial computing ability and very intuitive graphical representation, and the improvement of the comprehensive performance of computer hardware can meet the requirements of GIS system for high-sp...

Claims


Application Information

Patent Timeline
IPC IPC(8): G06F17/30
Inventor 张晨林静阮毅勇吴汝伟步鸣笛
Owner CHINA TELECOM CORP LTD
Why Eureka
Try Eureka