

Data visualization system based on Web
A data and database technology, applied in the field of information visualization, can solve problems such as poor applicability, high client hardware requirements, and high customer use costs, and achieve the effects of performance improvement, rich display forms, and low hardware requirements
- Summary
- Abstract
- Description
- Claims
- Application Information
AI Technical Summary
Problems solved by technology
Method used
Image

Examples
Embodiment Construction
[0029] The present invention will be further described below in conjunction with the accompanying drawings.
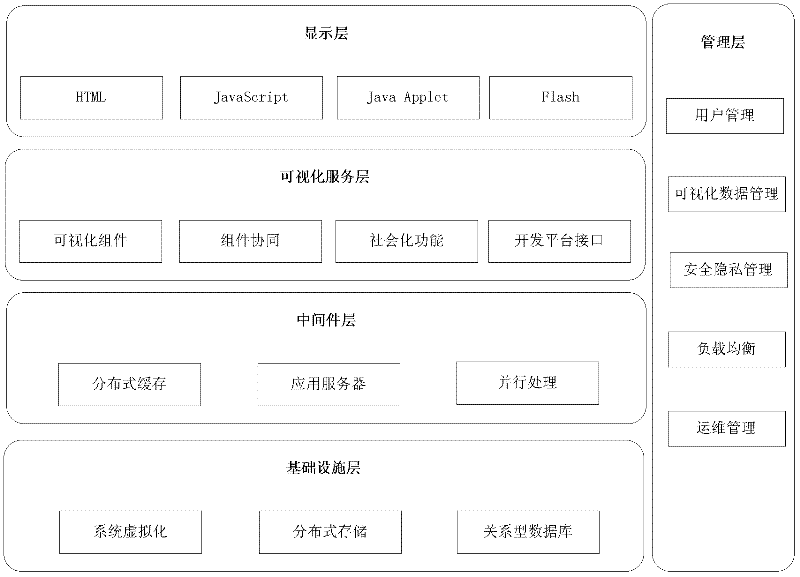
[0030] refer to Figure 1 ~ Figure 3 , a web-based data visualization system, this system can be used for visual analysis of various types of data, including public data and private data of corresponding institutions. The final result of the present invention is presented to the user in the form of a service. The user only needs a terminal device with basic computing capabilities and an effective Internet connection to access and use the visualization service anytime and anywhere, and interact through a browser to obtain a variety of forms. The visualization results of other users can solve the problem of visualization collaboration and sharing by browsing the visualization results of other users, and realize social collaboration visualization.
[0031] The Web service background server used by the system of the present invention receives the data request of the clien...
PUM
 Abstract
Description
Claims
Application Information