
Multi-scale rock physical charting method and device for detecting reservoir hydrocarbon

A petrophysical, multi-scale technology, applied in the field of petrophysical models and seismic data inversion and interpretation, it can solve the problems that cannot be applied to multi-scale waveform data, cannot achieve quantitative inversion of reservoir rock parameters and fluid saturation, and cannot. Meet the problems of non-uniform and complex formation engineering applications, etc.

Active Publication Date: 2013-01-02
PETROCHINA CO LTD
View PDF2 Cites 41 Cited by
  • Summary
  • Abstract
  • Description
  • Claims
  • Application Information

AI Technical Summary

Problems solved by technology

[0007] (1) In the conventional petrophysical plate technology, the generally used fluid replacement method is the Biot-Gassmann equation. The premise of this equation is that all pores inside the rock are assumed to be completely uniform, so this assumption cannot satisfy the non-uniform Engineering Application of Complicated Strata
[0008] (2) Conventional petrophysical plate technology is often aimed at waveform data at a single scale, and cannot be applied to multi-scale waveform data, and cannot jointly utilize multi-scale elastic wave information to serve industrial production
[0009] (3) Due to the lack of sufficient prior information and criteria, the accuracy of conventional petrophysical charts is limited, and often can only assist in the qualitative interpretation of reservoir lithology and fluids, and cannot quantify reservoir rock parameters and fluid saturation inversion

Method used


Image

  • Multi-scale rock physical charting method and device for detecting reservoir hydrocarbon
  • Multi-scale rock physical charting method and device for detecting reservoir hydrocarbon
  • Multi-scale rock physical charting method and device for detecting reservoir hydrocarbon

Examples


Embodiment 1

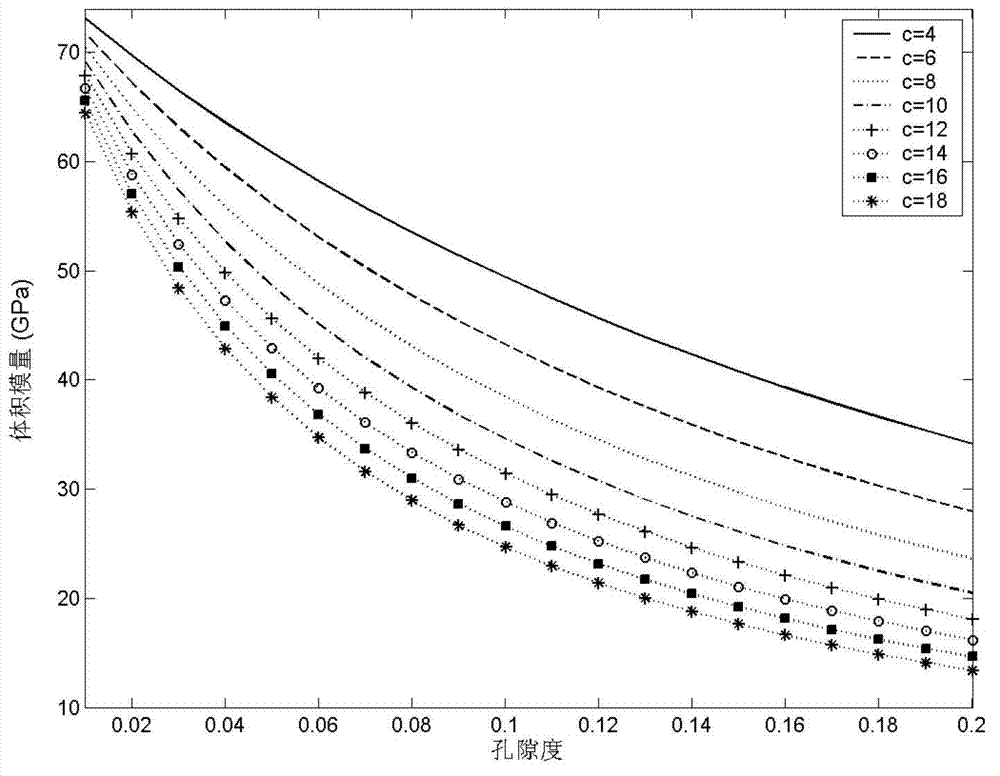
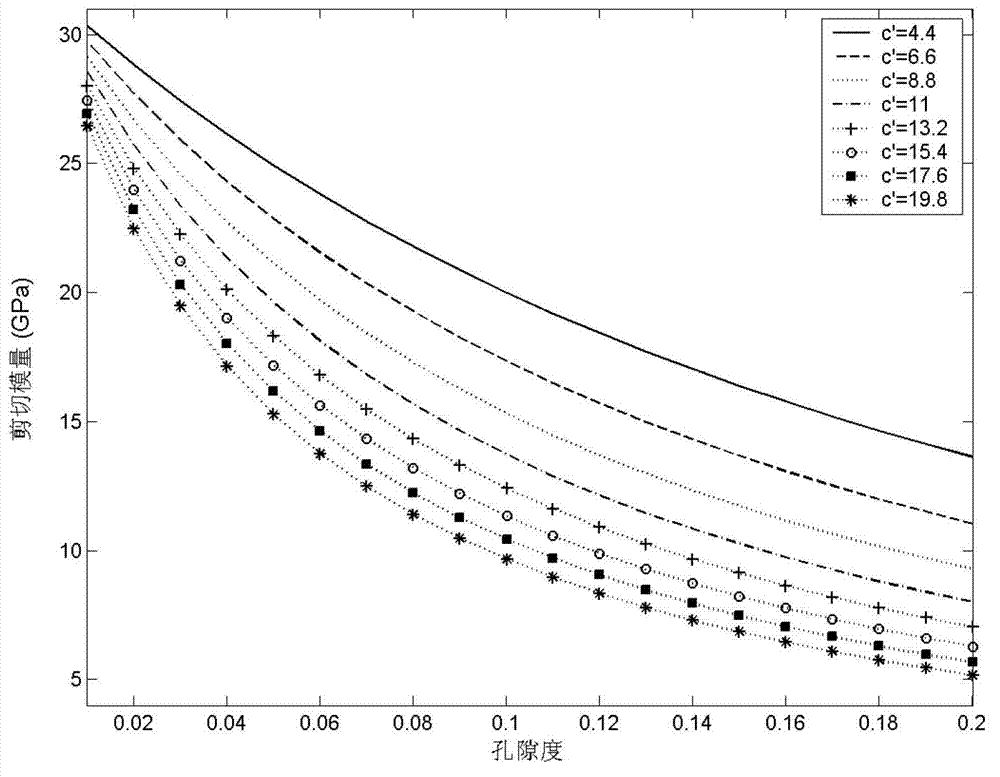
[0111] Example 1: Theoretical prediction results of bulk modulus and shear modulus of rock skeleton

[0112] Taking limestone as an example, if the rock matrix is ​​mainly composed of calcite and a small amount of mud, and different consolidation parameters c and c are selected, the relationship between the volume and shear modulus of the dry skeleton of the rock with porosity is as follows: Figure 2A Figure 2B shown. The elastic parameters of the rock skeleton decrease as the porosity increases, and the decreasing trend becomes more obvious as the consolidation degree of the rock becomes weaker. The degree of consolidation of the rock can be determined according to the specific conditions of the reservoir.

Embodiment 2

[0113] Example 2: Theoretical Calculation Results of P-wave Velocity and Attenuation of Gas and Water-bearing Rocks

[0114] Taking limestone as an example, the parameters of the rock skeleton are: porosity 0.16, skeleton bulk modulus 24.81GPa, skeleton shear modulus 11.79GPa, permeability 30.23mD, and average bubble size 5mm. The rock matrix is ​​calcite, and the reservoir temperature, fluid density under pressure and elastic parameters can be estimated according to van der Waals. Figure 3A and Figure 3B The P-wave velocity in unsaturated limestone at different frequencies is given ( Figure 3A ) and attenuation ( Figure 3B ) with water saturation. For the same piece of limestone, the relationship between P-wave velocity and water saturation is significantly different at different frequencies. , the P-wave velocity increases approximately linearly and monotonically with the increase of water saturation.

Embodiment 3

[0115] Example 3: Comparison of petrophysical charts and experimental data

[0116] Figure 4A and Figure 4B The comparison results between the corrected petrophysical plates and experimental data in different frequency bands are given ( Figure 4A is the ultrasonic frequency band, Figure 4B below the sonic frequency band). In Figure 4~ Figure 6 In , the por marked on the plate indicates porosity, Sw indicates water saturation, and SampleA~G indicate seven carbonate rock samples. exist Figure 4A and Figure 4B In , the scatter color scale represents the water saturation (Sw), the darker the color, the higher the water saturation, black is 1 (completely water-containing), white is 0 (completely gas-containing). The wave velocity observation results of carbonate unsaturated experiments published in previous literatures are rare, especially the experimental data below the acoustic frequency band (including the seismic frequency band) is relatively rare. Figure 4A and...


PUM

PropertyMeasurementUnit
Bulk modulusaaaaaaaaaa
Shear modulusaaaaaaaaaa
Permeabilityaaaaaaaaaa

Abstract

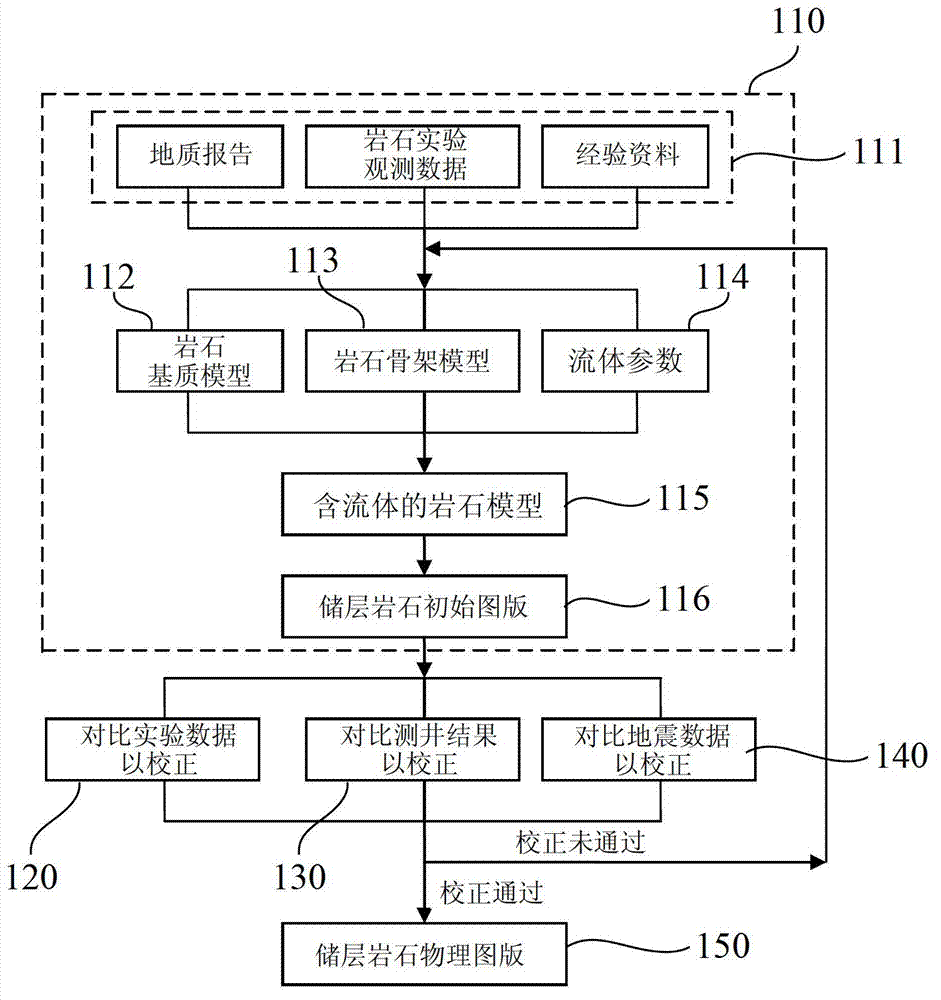
The invention provides a multi-scale rock physical charting method and device for detecting reservoir hydrocarbon. The method comprises the steps as follows: obtaining a reservoir rock matrix model and a reservoir rock framework model; acquiring a liquid-containing rock model according to the reservoir rock matrix model, the reservoir rock framework model and liquid parameters; obtaining a multi-scale initial reservoir rock physical chart according to the liquid-containing rock model; correcting the initial reservoir rock physical chart under a plurality of frequency bands according to the rock physical experimental data: correcting the initial reservoir rock physical chart under an acoustic logging frequency band based on the logging interpretation result; correcting the initial reservoir rock physical chart based on the seismic interpretation result; and outputting the final reservoir rock physical chart after the correction, so as to carry out inversion of a reservoir rock physical parameter. With the adoption of the method provided by the invention, the precision of the rock physical chart can be increased, and the quantitative inversion of the rock parameter and the saturation of the liquid can be realized.

Description

technical field [0001] The invention relates to the fields of petrophysical models and seismic data inversion and interpretation in geophysical exploration, in particular to a multi-scale petrophysical drawing method and device for hydrocarbon detection in reservoirs. Background technique [0002] The reservoir porosity-permeability relationship in heterogeneous oil and gas reservoirs is complex, and the immiscible oil, gas, and water in the rock pores are generally distributed in "patch-like (patch-like)" shape. The size of a single "patch" or "plaque" is larger than a rock grain and a single pore, but far below the seismic wavelength, approaching the order of mm. Such inhomogeneity is generally defined as mesoscale inhomogeneity. The non-uniform distribution of fluids leads to inconspicuous differentiation of various fluids in the reservoir, which brings difficulties to the actual seismic exploration engineering. In order to develop seismic detection technology for heter...

Claims


Application Information

Patent Timeline
IPC IPC(8): G01V1/28
Inventor 巴晶晏信飞曹宏徐光成卢明辉孙卫涛
Owner PETROCHINA CO LTD
Learn More