Symbol configuration system of zonal statistical map and method thereof

A technology of map symbols and zoning statistics, which is applied to maps/plans/charts, instruments, educational tools, etc., and can solve problems such as the configuration of non-zoning statistics map symbols

Inactive Publication Date: 2013-03-13
INST OF GEOGRAPHICAL SCI & NATURAL RESOURCE RES CAS
View PDF3 Cites 8 Cited by
  • Summary
  • Abstract
  • Description
  • Claims
  • Application Information

AI Technical Summary

Problems solved by technology

[0004] Among the patents that have been applied for so far, there

Method used


Image

  • Symbol configuration system of zonal statistical map and method thereof
  • Symbol configuration system of zonal statistical map and method thereof
  • Symbol configuration system of zonal statistical map and method thereof

Examples


Embodiment Construction

[0059] The present invention will be described in detail below in conjunction with the accompanying drawings and specific embodiments, but not as a limitation of the present invention.

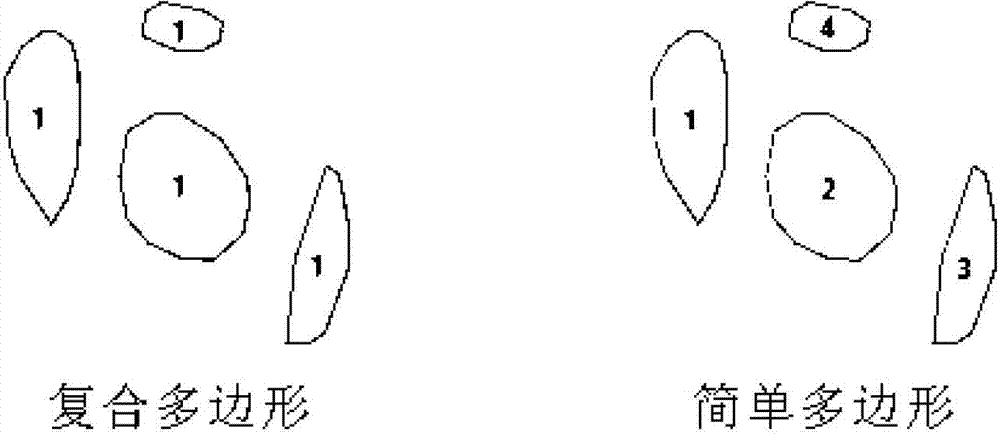
[0060] like figure 1 As shown, it is an example of a composite polygon of the present invention (1:1, one division unit corresponds to one record); figure 2 It is an example of a polygon with the same name in the present invention (1:n, one division unit corresponds to multiple records); image 3 It is a schematic diagram of ineffective positioning of statistical map symbols under multiple polygons with the same name in the present invention.

[0061] For the case where the zoning unit is a simple polygon, the symbols of the zonal statistical thematic map are mostly positioned by the center of gravity or interior point of the polygon. Considering that the center of gravity of the polygon sometimes falls outside the polygon, the present invention adopts the inner point of the polygon for pos...


PUM


Abstract

The invention discloses a symbol configuration system of a zonal statistical map and a method thereof. The symbol configuration system comprises a simple polygon set construction module for constructing a simple polygon set, a simple polygon inner point evaluating module for evaluating inner points of a simple polygon, an area domination set evaluating module for evaluating an area dominated simple polygon set, a positioning polygon obtaining module for evaluating a positioning polygon, wherein the simple polygon inner point evaluating module is used for evaluating inner points of the positioning polygon, a point set convex hull evaluating module for evaluating a point set convex hull, a positioning point evaluating module used for using the gravity center of the point set convex hull as a positioning point and a map symbol positioning point evaluating module for using the inner points of the simple polygon, the inner points of the positioning polygon, the gravity center of the point set convex hull and primary positioning points as map symbol positioning points. The symbol configuration system supports statistical map symbol positioning of a composite polygon and a plurality of elements with the same name.

Description

technical field [0001] The invention belongs to the field of map visualization, and in particular relates to a system and a method for supporting the configuration, storage and editing of positioning points of area-shaped elements and statistical thematic map symbols. Background technique [0002] According to the data characteristics of the statistical data, the spatial distribution law of the statistical data is expressed in the form of a map. For each statistical area, a statistical thematic map is formed. Zonal statistical chart method is often used to represent the overall situation of a certain type of geographical phenomenon within a division unit. The statistical map symbols used include: histogram (bar graph, 2-dimensional / 3-dimensional), pie chart (circle, ring, fan-shaped , 2D / 3D), spherical graphs and other types. It draws statistical charts on the corresponding spatial positions, and can form various forms of zonal statistical thematic maps. [0003] Statistic...

Claims


Application Information

Patent Timeline
IPC IPC(8): G09B29/10
Inventor 李洪省余卓渊王英杰
Owner INST OF GEOGRAPHICAL SCI & NATURAL RESOURCE RES CAS
Why Eureka
Try Eureka