Multi-dimensional power flow evaluation index method based on statistical analysis of power grid historical information

A technology of evaluation indicators and statistical analysis, applied in computing, instrumentation, data processing applications, etc., can solve problems such as the lag in the application value of power grid historical data

Active Publication Date: 2016-08-24
EAST CHINA GRID +1
View PDF2 Cites 0 Cited by
  • Summary
  • Abstract
  • Description
  • Claims
  • Application Information

AI Technical Summary

Problems solved by technology

[0004] During the long-term operation of the power grid, a large amount of historical data has been accumulated. These data describe the long-term operation status and change trend of the power system, and contain the trend characteristics of the power grid operation. The development of

Method used


Image

  • Multi-dimensional power flow evaluation index method based on statistical analysis of power grid historical information
  • Multi-dimensional power flow evaluation index method based on statistical analysis of power grid historical information
  • Multi-dimensional power flow evaluation index method based on statistical analysis of power grid historical information

Examples


Embodiment Construction

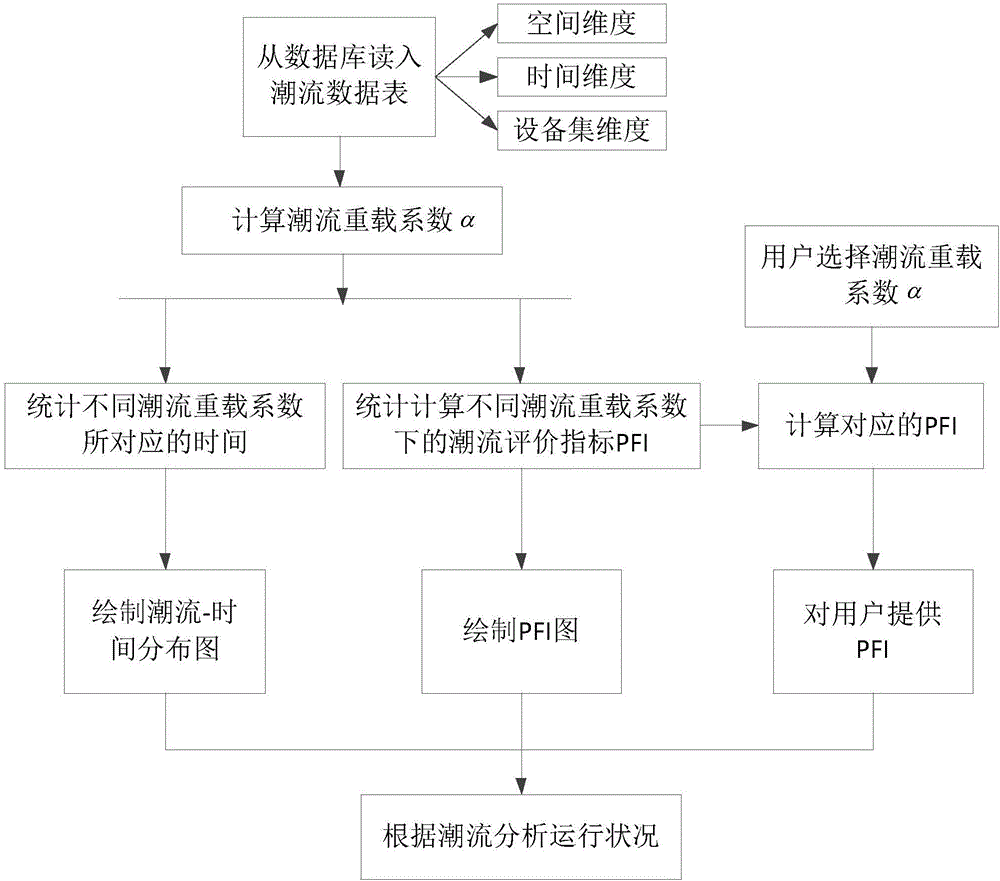
[0042] see Figure 1 to Figure 5 , the present invention provides a multi-dimensional power flow evaluation index method based on statistical analysis of power grid historical information, comprising the following steps:

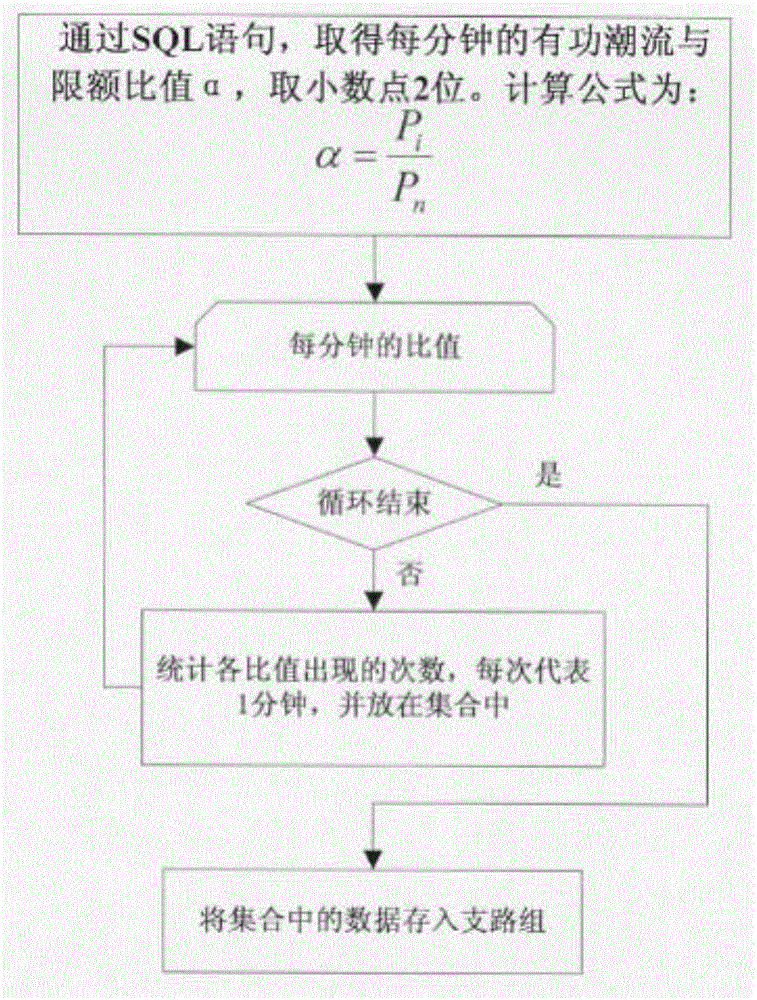
[0043] A. Power flow information preprocessing: take out the historical power flow data within the selected time interval from the database, the historical power flow data includes time attributes, space attributes and equipment set attributes. Calculate the power flow overload coefficient α representing the power flow overload degree of a single device or transmission section, such as figure 1 shown. The calculation process of α is as follows figure 2 As shown in Fig. 1, the historical power flow data taken out is compared with the limit value of the equipment or section, and the calculation results are saved in the database, which is the basis for the analysis of the power flow information.

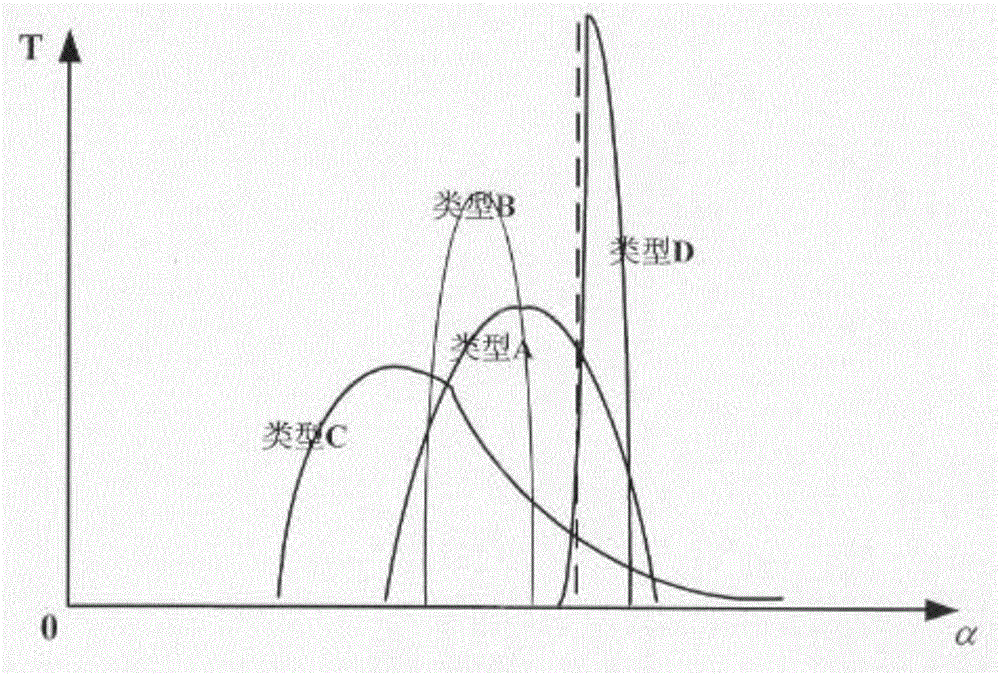
[0044] B. Statistical calculation of power flow time charact...


PUM


Abstract

The invention relates to a multi-dimensional power flow evaluation index method based on the statistic analysis of the historical information of a power grid. The method comprises the following steps of: preprocessing power flow information: acquiring the power flow information in a selected time interval from a database, calculating a power flow overload coefficient alpha representing the power flow overload degree of single equipment or a power transmission cross section, and comparing the acquired historical power flow data with the limit value of the equipment or the cross section; carrying out statistic calculation on power flow time features: counting time corresponding to different power flow overload degrees through the utilization of the power flow overload coefficients and the corresponding time periods, and summing the time periods to obtain the relationship between the power flow overload degrees and the running time; and carrying out statistic calculation on the multi-dimensional power flow evaluation indexes (PFI). According to the multi-dimensional power flow evaluation index method, a power flow distribution curve is drawn on the basis of the historical data of the power grid according to the power flow evaluation indexes (PFI), an auxiliary means is provided for the power flow analysis and the power flow prediction of the power transmission cross section of the power grid and the medium and long term statistic analysis of the power grid, and the key power flow control indexes of the power grid are converted to the multi-dimensional statistic indexes.

Description

technical field [0001] The invention relates to a statistical and multi-dimensional grid power flow evaluation method. Based on the grid historical data, by counting the power flow information of a single device or an important power transmission section, the evaluation index representing the qualified rate of the power flow is calculated. The analyzed multi-dimensional power flow evaluation index method reflects the health degree and change trend of the current power grid operation, and provides reliable auxiliary decision-making for the adjustment of power grid operation mode and risk preventive control. Background technique [0002] Power grid power flow is one of the most direct reflections of the operating state of the power system. When the power grid is in normal operation, its power flow is within a reasonable range; when some equipment in the power grid is abnormal or faulty and forced to withdraw from operation, resulting in a decrease in the stability limit of rel...

Claims


Application Information

Patent Timeline
Patent Type & Authority Patents(China)
IPC IPC(8): G06Q50/06
Inventor 李维周毅周良才黄志光陈磊刘林林徐尧强吴超周晓苏米向宾郭佳姚新苗裘天亮
Owner EAST CHINA GRID
Why Eureka
Try Eureka