Method for constructing mechanical property main curve of viscoelastic material
A technology of viscoelastic material and elastic material, which is applied in the field of accelerated characterization of mechanical properties of viscoelastic material, and achieves the effect of simple and easy method.
- Summary
- Abstract
- Description
- Claims
- Application Information
AI Technical Summary
Problems solved by technology
Method used
Image
Examples
Embodiment 1
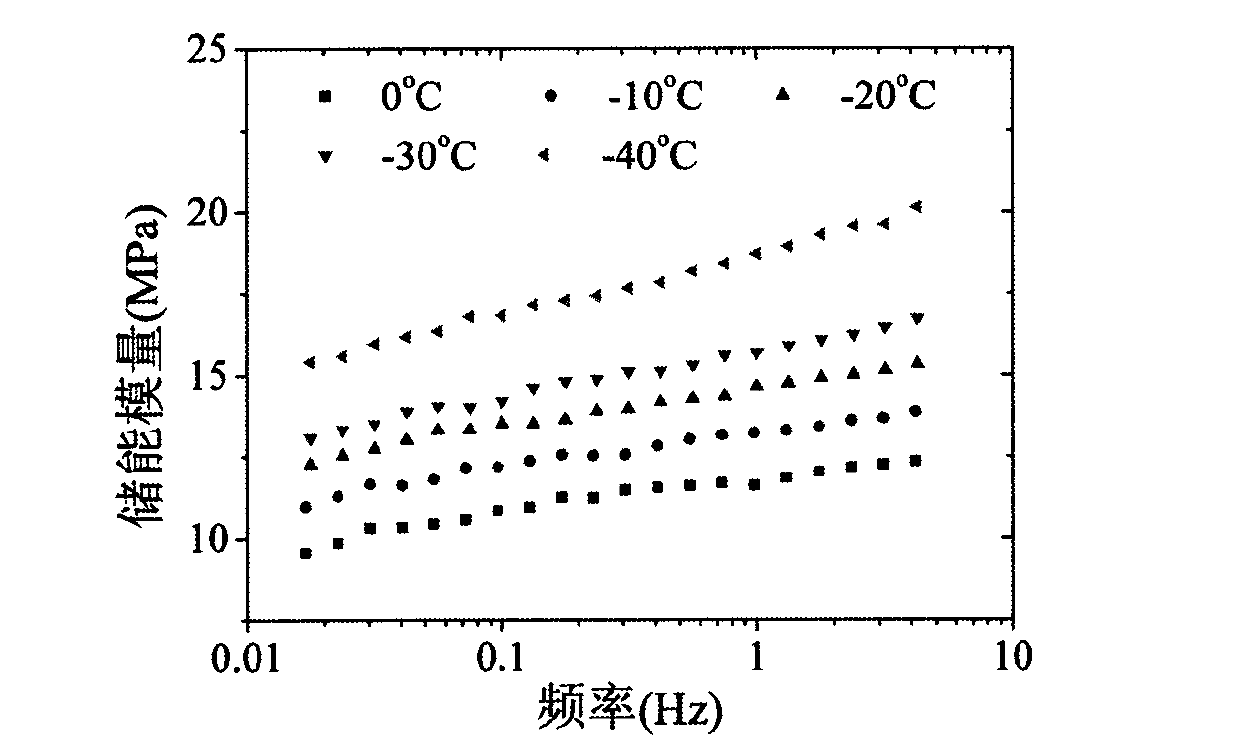
[0050] A method for constructing a master curve of mechanical properties of a viscoelastic material, which is used to construct a master curve of storage modulus of carbon black-filled rubber. There are 5 test curves in this embodiment, such as figure 2 As shown, none of the curves contain peaks.
[0051] Step 1. With the frequency f as the abscissa and the storage modulus E' as the ordinate, arrange the curves according to the test temperature from high to low as L 1 , L 2 , L 3 , L 4 and L 5 .
[0052] Step 2 converts the data of all curves into logarithmic data. After this step, the data obtained are shown in Table 1.
[0053] Each curve parameter and data of table 1 embodiment 1
[0054]
[0055] Step 3 calculates the displacement factors of the two adjacent curves respectively, and among the two adjacent curves, the former is the reference curve of the latter. It can be seen from Table 1 that the curve L 1 The modulus interval is [0.98, 1.0913], L 2 The modu...
Embodiment 2
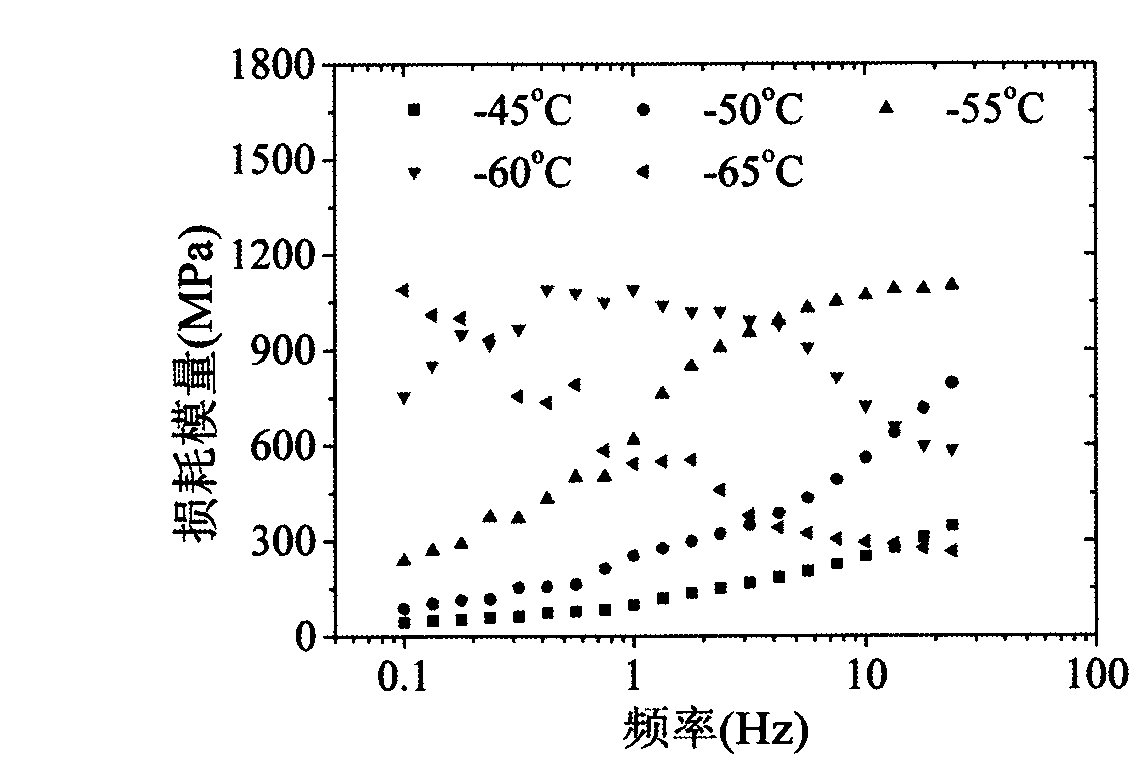
[0061] A method for constructing a master curve of the mechanical properties of a viscoelastic material, which is used to construct a master curve of loss modulus of carbon black-filled rubber. There are 5 test curves in this embodiment, such as image 3 As shown, one of the curves contains a peak.
[0062] Step 1. With the frequency f as the abscissa and the loss modulus E" as the ordinate, arrange the curves according to the test temperature from high to low as L 1 , L 2 , L 3 , L 4 and L 5 .
[0063] Step 2 converts the data of all curves into logarithmic data. After this step, the data obtained are shown in Table 2. Among them, L4 is the curve including the peak value.
[0064] Each curve parameter and data of table 2 embodiment 2
[0065]
[0066]
[0067] In step 3, the shift factors of the two adjacent curves are respectively calculated to obtain D=[0, 0.8809, 1.0830, 1.5101, 1.5921].
[0068] Step 4 calculates each curve relative to L 1 The shift factor...
PUM
 Abstract
Description
Claims
Application Information
 - R&D
- Intellectual Property
- Life Sciences
- Materials
- Tech Scout
- Unparalleled Data Quality
- Higher Quality Content
- 60% Fewer Hallucinations
Browse by: Latest US Patents, China's latest patents, Technical Efficacy Thesaurus, Application Domain, Technology Topic, Popular Technical Reports.
© 2025 PatSnap. All rights reserved.Legal|Privacy policy|Modern Slavery Act Transparency Statement|Sitemap|About US| Contact US: help@patsnap.com


