Fast control method of planned isolated island power supply switching power balance based on wide range information
A fast control and wide-area information technology, applied in information technology support system, AC network voltage adjustment, single-network parallel feeding arrangement, etc., can solve switching failure, difficulty in switching between voltage control and current control, and does not consider grid connection Operational adaptability, inrush current suppression, etc.
- Summary
- Abstract
- Description
- Claims
- Application Information
AI Technical Summary
Problems solved by technology
Method used
Image
Examples
Embodiment approach 1
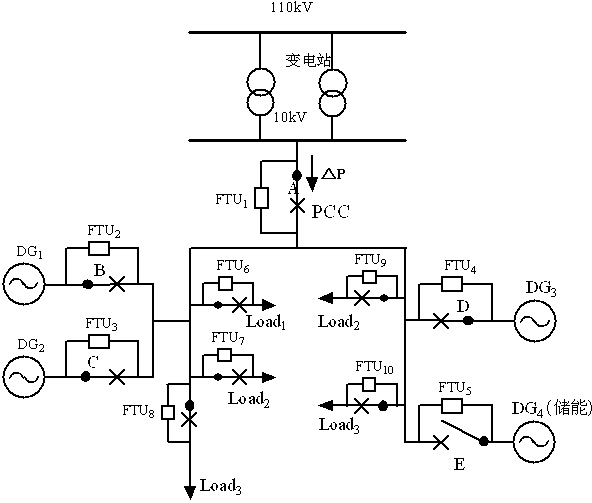
[0028] Implementation Mode 1: The system diagram is as follows figure 1 As shown, the size of each distributed power source and load is shown in the table below.
[0029] Table 1 Distributed Power Design Capacity Unit: kW
[0030] gas turbine 20 fan 12 solar energy 10 energy storage 12
[0031] Table 2 Real-time monitoring capacity of distributed power generation Unit: kW
[0032] gas turbine 20 fan 8.1 solar energy 6.5 energy storage 12
[0033] Table 3 Maximum capacity of local load Unit: kW
[0034]
10
3+2+4+2.6=11.6
1+1+1+2+2+2+5+6+12=32
[0035] Table 4 Real-time monitoring capacity of local load Unit: kW
[0036]
10
10
1+1+1+2+2+2+5=14
[0037] =42kW
[0038] =34.6kW (excluding energy storage)
[0039] =34kW
[0040] Power difference =34-34.6=-0.6 kW
[0041] threshold =3.46 kW (here c% ...
Embodiment approach 2
[0043] Implementation Mode 2: The system diagram is as follows figure 1 As shown, the size of each distributed power source and load is shown in the table below.
[0044] Table 5 Distributed Power Design Capacity Unit: kW
[0045] gas turbine 20 fan 12 solar energy 10 energy storage 12
[0046] Table 6 Real-time monitoring capacity of distributed power generation Unit: kW
[0047] gas turbine 20 fan 8.1 solar energy 6.5 energy storage 12
[0048] Table 7 Maximum capacity of local load Unit: kW
[0049]
10
3+2+4+2.6=11.6
1+1+1+2+2+2+5+6+12=32
[0050] Table 8 Real-time monitoring capacity of local load Unit: kW
[0051]
10
10
1+1+1+2+2+2+5+12=26
[0052] =42kW
[0053] =34.6kW (excluding energy storage)
[0054] =46kW
[0055] Power difference =11.4kW
[0056] threshold =3.46 kW (here c% =10%) ...
Embodiment approach 3
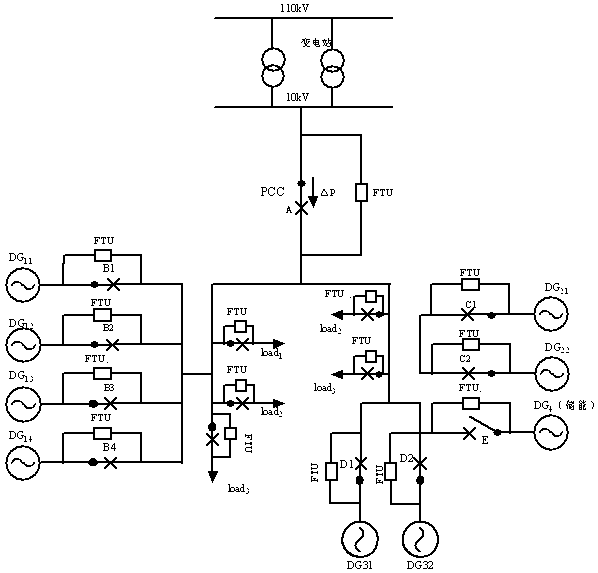
[0063] Implementation Mode 3: The system diagram is as follows figure 2 As shown, the size of each distributed power source and load is shown in the table below.
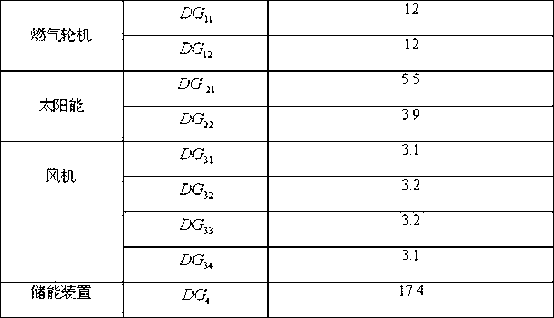
[0064] Table 9 Distributed Power Design Capacity Unit: kW
[0065]
[0066] Table 10 Real-time monitoring capacity of distributed power generation Unit: kW
[0067]
[0068] Table 11 Maximum capacity of local load Unit: kW
[0069]
8
2+2+2+4=10
1+1+1+2+2+2+5=14
[0070] Table 12 Real-time monitoring capacity of local load Unit: kW
[0071]
8
2+2+4=8
1+1+1+2+2+5=12
[0072] =58kW
[0073] =46kW
[0074] =28kW
[0075] Power difference =-18kW
[0076] threshold =4.6kW
[0077] , planning the active power surplus of the isolated island, it is necessary to cut the machine, according to the output of the distributed power supply, optimize the adjustment and form the machine cut plan, so that the power can be q...
PUM
 Abstract
Description
Claims
Application Information
 - R&D
- Intellectual Property
- Life Sciences
- Materials
- Tech Scout
- Unparalleled Data Quality
- Higher Quality Content
- 60% Fewer Hallucinations
Browse by: Latest US Patents, China's latest patents, Technical Efficacy Thesaurus, Application Domain, Technology Topic, Popular Technical Reports.
© 2025 PatSnap. All rights reserved.Legal|Privacy policy|Modern Slavery Act Transparency Statement|Sitemap|About US| Contact US: help@patsnap.com


