Sampling GPR method of continuous anomaly detection in collecting data flow of environment sensor
An environmental sensor and anomaly detection technology, applied in electrical digital data processing, special data processing applications, instruments, etc., can solve the problems of large amount of data calculation, inability to real-time anomaly detection, etc., to achieve the effect of increasing the efficiency of algorithm execution
- Summary
- Abstract
- Description
- Claims
- Application Information
AI Technical Summary
Problems solved by technology
Method used
Image
Examples
specific Embodiment approach 1
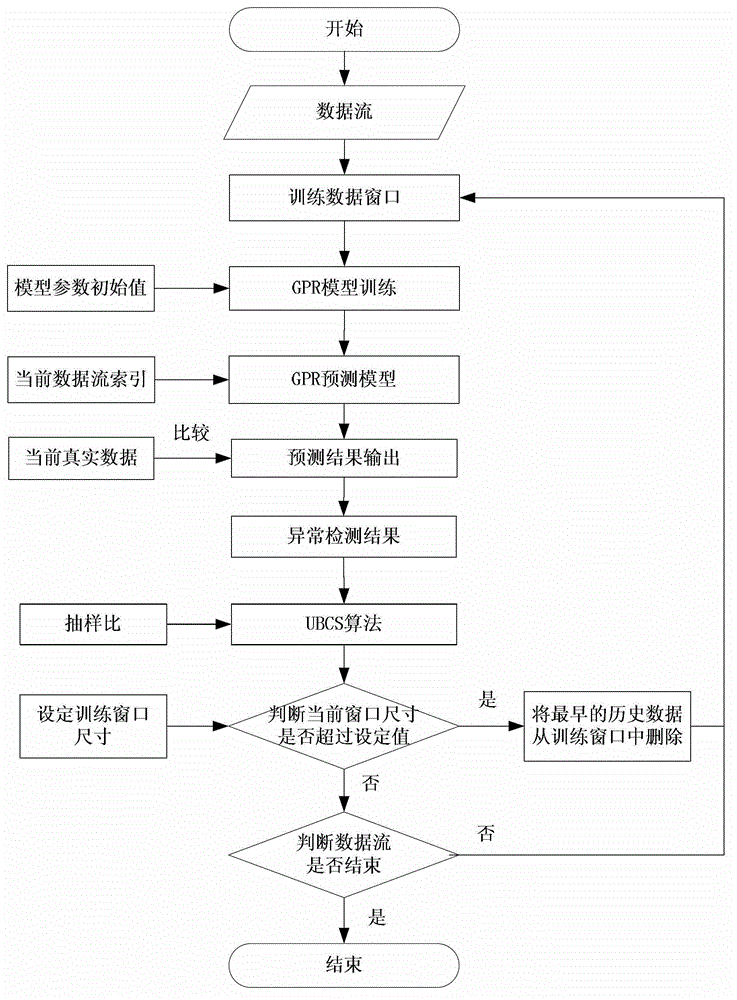
[0029] Specific implementation mode one: the following combination figure 1 Describe this embodiment, the sampling GPR method of continuous anomaly detection in the collection data flow of environment sensor described in this embodiment, it comprises the following steps:
[0030] Step 1: Set the size of the sliding window of the environmental sensor sensing data to N, and set the sampling ratio to B:1, and sample the first N*B data streams in the sliding window as offline data, and obtain N*B data as the initial forecast window data, and form the forecast window D according to the initial forecast window data T ;
[0031] Step 2: Use the next moment data element index adjacent to the current moment in the environmental sensor sensing data stream as the prediction window D T The input value of the prediction window D T Output the predicted mean value of the data elements in the environmental sensor sensing data stream at the next moment, and obtain the variance corresponding...
specific Embodiment approach 2
[0036] Specific implementation mode 2: This implementation mode further explains the implementation mode 1, and the prediction window D in this implementation mode T ={x i-Q ,x i-Q+1 ,...,x i}, where i represents the current moment, Q is the prediction window D T The size of , and Q=N*B, x is the prediction window data at the time corresponding to its subscript;
[0037] Data element x at the next moment i+1 The index of as the prediction window D T The input value of , get the data element x i+1 The predicted mean of and the variance q corresponding to the predicted mean;
[0038] The 95% confidence interval for determining the data elements at the next moment is
specific Embodiment approach 3
[0039] Specific implementation mode three: the following combination Figure 5 Describe this implementation mode. This implementation mode will further explain the second embodiment mode. In the fifth step of this embodiment mode, use the UBCS algorithm to determine whether the data element at the next moment is added to the prediction window D T The specific method is:
[0040] Step 51: According to the sliding window size N of the environmental sensor sensing data, set its sampling size to k, then the size of each basic window is N / k, and the ratio of N / k is the ratio of rounding down, then the first The data element index in one basic window is [1,2,3,...,N / k], and the data element index in the second basic window is [N / k+1,N / k+2, ...,2*N / k],..., the data element index in the I-th basic window is [(I-1)*N / k+1,...,I*N / k];
[0041] Step 52: From the prediction window D T Randomly select the next data element index in as the representative index;
[0042] Step 53: When the...
PUM
 Abstract
Description
Claims
Application Information
 - R&D
- Intellectual Property
- Life Sciences
- Materials
- Tech Scout
- Unparalleled Data Quality
- Higher Quality Content
- 60% Fewer Hallucinations
Browse by: Latest US Patents, China's latest patents, Technical Efficacy Thesaurus, Application Domain, Technology Topic, Popular Technical Reports.
© 2025 PatSnap. All rights reserved.Legal|Privacy policy|Modern Slavery Act Transparency Statement|Sitemap|About US| Contact US: help@patsnap.com


