Method for achieving multi-dimensional bidirectional free-matching visual display of electric power data and graphics

A technology of power data and implementation method, applied in the field of data display, can solve the problems of one-sided information, poor intuitiveness, complicated and complicated system, etc., and achieve the effect of free matching of two-way data graphics

Active Publication Date: 2014-04-02
STATE GRID CORP OF CHINA +3
View PDF5 Cites 9 Cited by
  • Summary
  • Abstract
  • Description
  • Claims
  • Application Information

AI Technical Summary

Problems solved by technology

[0002] With the gradual implementation of many intelligent information systems, the amount of information in intelligent substations and intelligent data analysis is becoming more and more abundant, and the description of the actual operation of substations is becoming more and more accurate and three-dimensional. Multi-dimensional display brings chal...

Method used


Image

  • Method for achieving multi-dimensional bidirectional free-matching visual display of electric power data and graphics
  • Method for achieving multi-dimensional bidirectional free-matching visual display of electric power data and graphics

Examples


Embodiment Construction

[0026] The technical solution of the present invention will be further described in detail below in conjunction with the accompanying drawings.

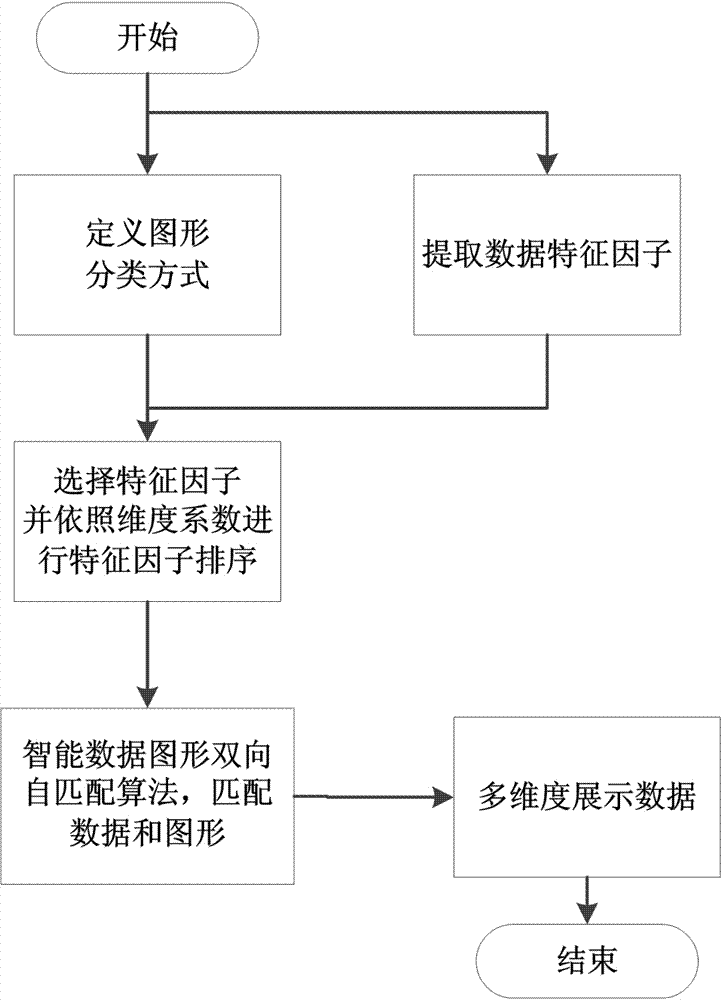
[0027] The present invention comprises the following steps:

[0028] (1) Define the graph classification method, that is, classify the graph according to its own characteristics and the characteristics of data display in the electric power field;

[0029] (2) Extract the eigenfactors of the power operation and maintenance data, in which the eigenfactors are used as the key attributes of data and graphics matching to perform multi-dimensional decomposition and extraction according to the characteristics of business data;

[0030] (3) According to the needs of business data display, select the feature factor and the number of dimensions, and set the dimension coefficient corresponding to the feature factor according to the data attention. the number of eigenfactors;

[0031] (4) Adopt intelligent data graph multi-dimensional two-way ...


PUM


Abstract

The invention provides a method for achieving the multi-dimensional bidirectional free-matching visual display of electric power data and graphics, which relates to a data display method. At present, most of the processing information about information data has the disadvantages of one-sidedness and poor intuition. The method comprises the following steps of: (1) defining graphics classification manners; (2) extracting characteristic factors of electric power operation and maintenance data; (3) selecting characteristic factors and dimension number according to business data display requirements; (4) ranking the characteristic factors and then matching same with graphics types in sequence, to achieve the multi-dimensional bidirectional free-matching of data and graphics; (5) respectively performing multi-dimensional visual display on the matched data according to dimension coefficients from high to low, the displayed graphics number being the dimension number. The technical scheme can not only achieve the multi-dimensional free-matching display from data to graphics, but also can selectively display data according to the requirements of displaying graphics, to more intelligently perform matching display on purpose, thereby achieving the free matching of data and graphics finally.

Description

technical field [0001] The invention relates to a data display method. Background technique [0002] With the gradual implementation of many intelligent information systems, the amount of information in intelligent substations and intelligent data analysis is becoming more and more abundant, and the description of the actual operation of substations is becoming more and more accurate and three-dimensional. The multi-dimensional display has brought challenges to the further construction of a smarter and more efficient active smart grid. [0003] At present, the vast majority of information and data processing is still in the process of preliminary business data collection, simple data report statistics, and information analysis based on a single business and a single system. The information is one-sided and poorly intuitive. Contents of the invention [0004] The technical problem to be solved and the technical task proposed by the present invention are to perfect and impr...

Claims


Application Information

Patent Timeline
IPC IPC(8): G06Q50/06G06F3/0481
Inventor 裘愉涛翁磊陈水耀刘石川黄晓明杨常府奚洪磊王均慧杨漪俊胡新猛李晓星
Owner STATE GRID CORP OF CHINA
Why Eureka
Try Eureka