Area data visualization method based on density clustering

A technology of regional data and density clustering, which is applied in the field of data processing and can solve problems such as inaccurate results.

Inactive Publication Date: 2014-04-09
NANJING UNIV OF SCI & TECH
View PDF3 Cites 18 Cited by
  • Summary
  • Abstract
  • Description
  • Claims
  • Application Information

AI Technical Summary

Problems solved by technology

However, the current general methods are simply to output random points in a specific area. The result of this method of directly visualizing the output of point density is inaccurate.

Method used


Image

  • Area data visualization method based on density clustering
  • Area data visualization method based on density clustering
  • Area data visualization method based on density clustering

Examples


Embodiment Construction

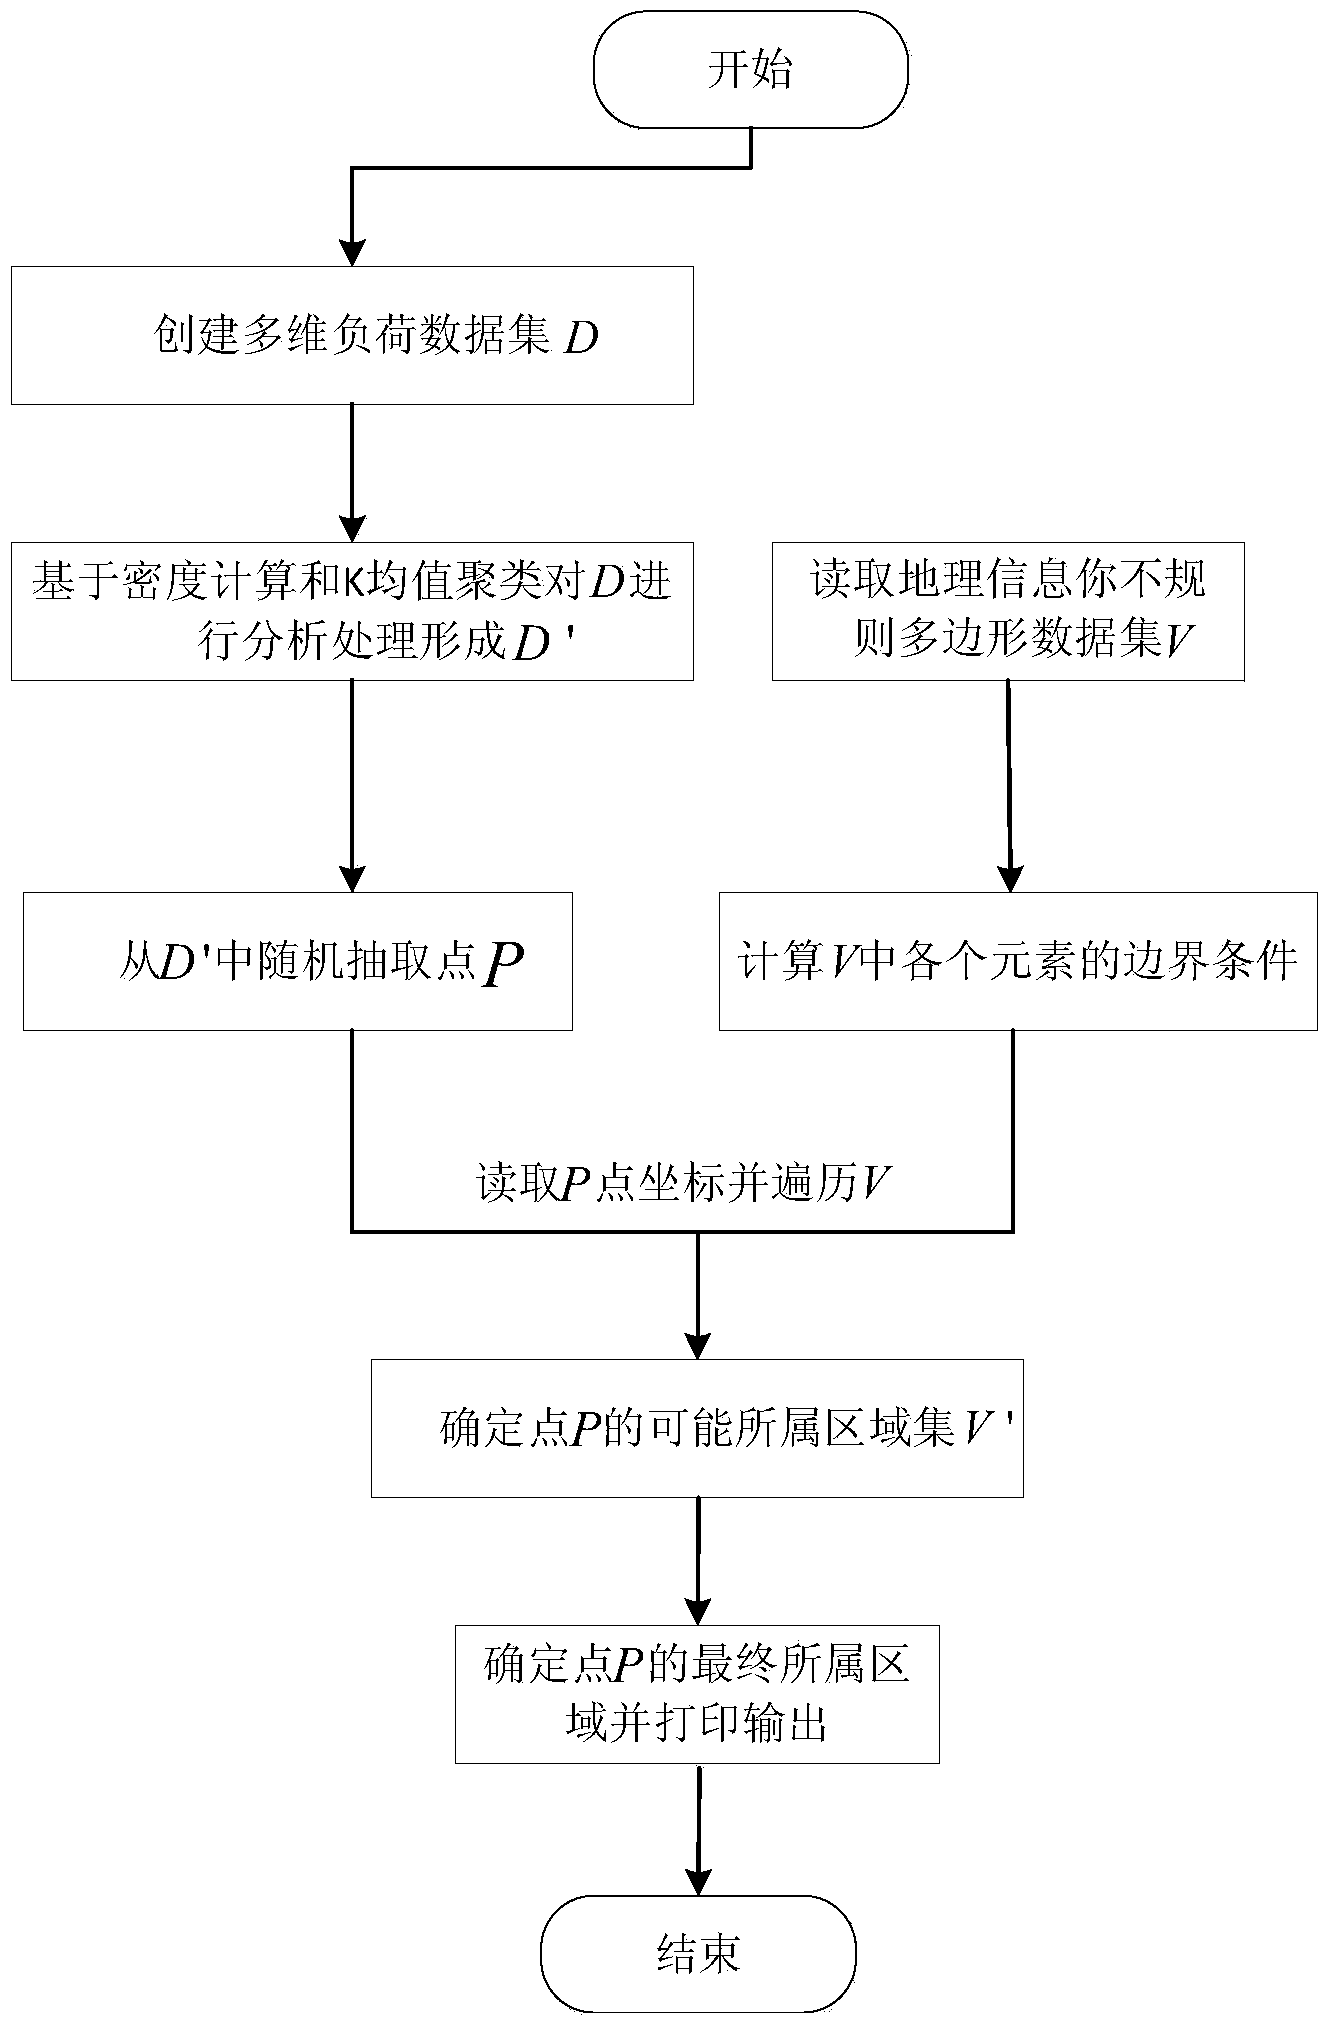
[0030] A method for visualizing regional data based on density clustering, the method includes the following steps:

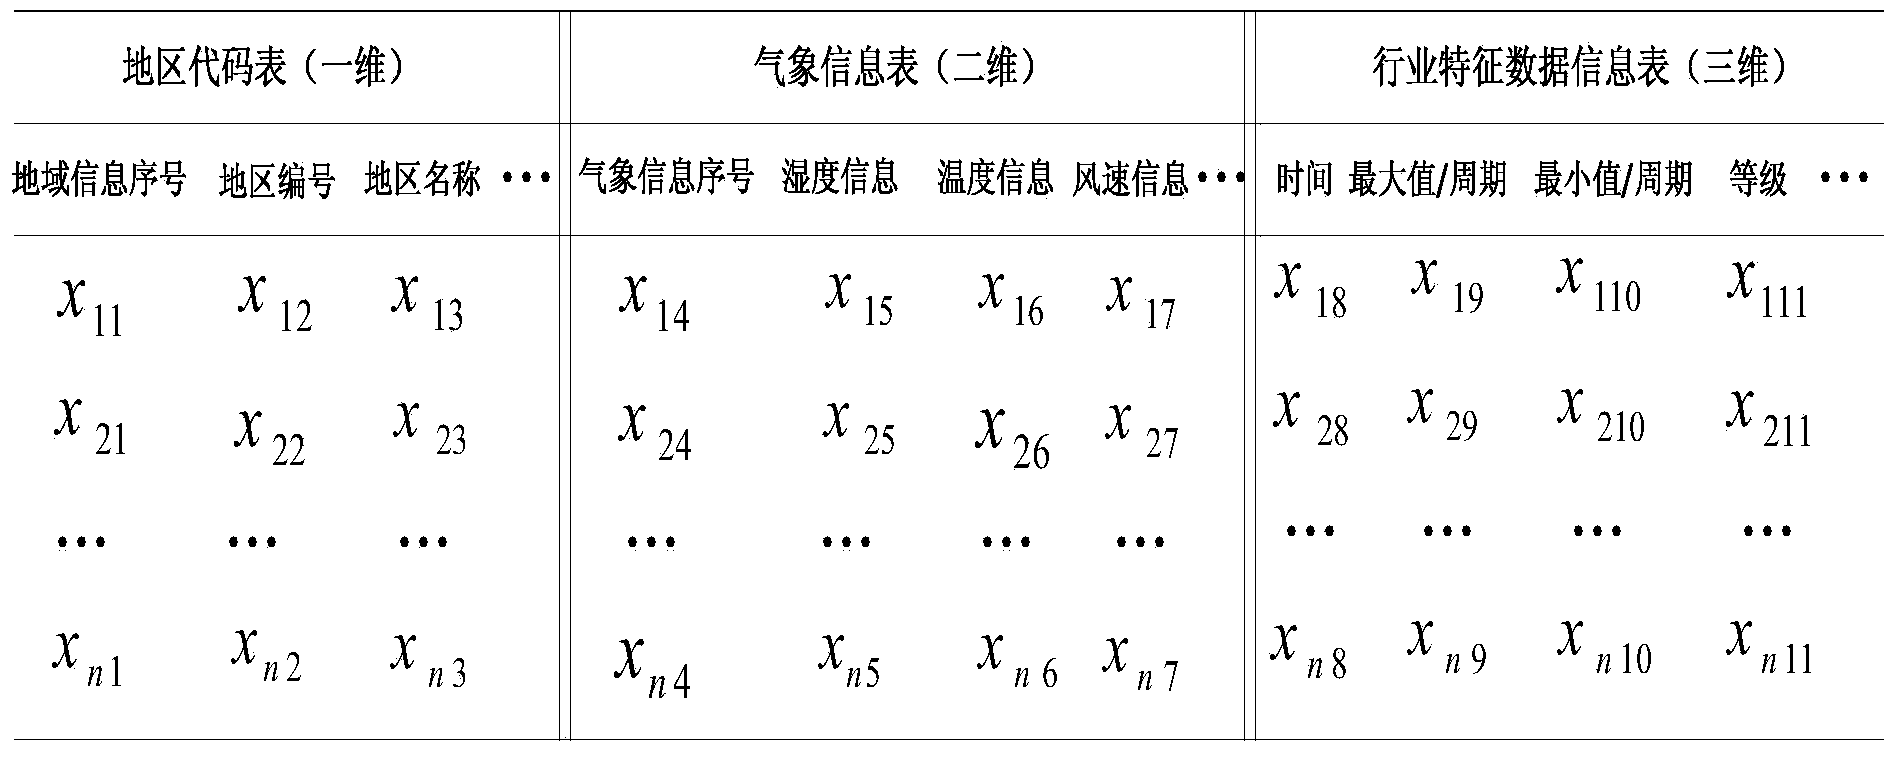
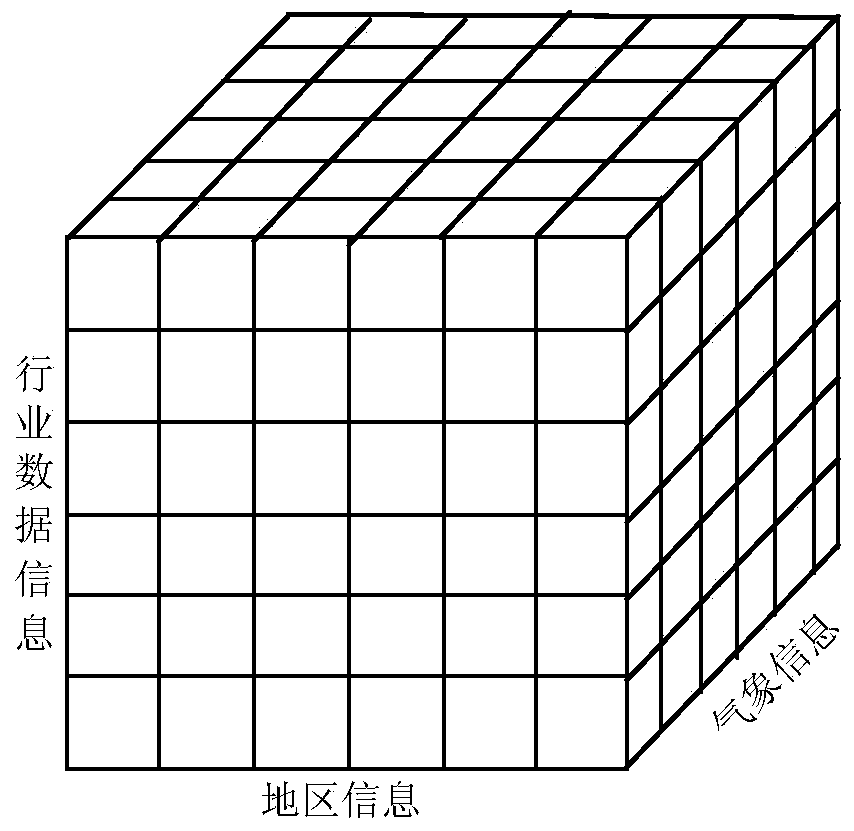
[0031] 1) Create a cube dataset.

[0032] Create a multi-dimensional data warehouse set D for clustering and load analysis, which mainly includes data subsets with industry representative characteristics, associated meteorological information data subsets, and associated area information code subsets. The data model established in a multi-dimensional way is beneficial to simplify the complexity of business analysis and improve the performance of data query.

[0033] 2) Clustering model based on density calculation.

[0034] For dataset D, the cluster center point is determined according to the estimation model of the following clustering target:

[0035] density ( x i ) = Σ j = 1 ...


PUM


Abstract

The invention discloses an area data visualization method based on density clustering. The method comprises the steps that a multidimensional data warehouse set for clustering and load analysis is built, and a data model which is built in a multidimensional mode and facilitates simplifying business analysis complexity and improving data query performance is obtained; a clustering model based on density calculation is obtained; all data points are output through a display device, an area data visualization result based on density clustering is obtained, and area data visualization is achieved. By means of the area data visualization method based on density clustering, a visual effect picture of the area data density visualization is obtained, and foundations which are more stable and reliable can be provided for reasonable distribution and decision analysis development of industry resources.

Description

technical field [0001] The invention relates to a data processing method, in particular to a method for visualizing regional data based on density clustering. Background technique [0002] In application systems such as electric power, medicine, agriculture, and modern service industries, it is often necessary to visualize the corresponding regional data to reflect the regional data distribution problems more intuitively. The visualization of regional data is more suitable to be described by a point density map, which is more in line with the human eye's perception and decision-making of density determination. Displaying Regional Data with Dot Density Maps Density maps usually use dots or other symbols to delineate specific data in a given specific area. The symbols can represent an entity or a group. When point density maps represent specific data, they can often be compared between regions. These symbols or dots do not clearly refer to their location. They usually represe...

Claims


Application Information

Patent Timeline
Patent Type & Authority Applications(China)
IPC IPC(8): G06F17/30G06T11/00
CPCG06F16/287G06F16/283
Inventor 曹杰王有权毛波陶海成
Owner NANJING UNIV OF SCI & TECH
Why Eureka
Try Eureka