Visualized quantitative evaluation method of oil and gas field similarity

A quantitative evaluation, oil and gas field technology, applied in special data processing applications, instruments, electrical digital data processing, etc., can solve the problem of high similarity of multiple similar oil and gas fields

Active Publication Date: 2014-06-11
CHINA NAT OFFSHORE OIL CORP +1
View PDF0 Cites 9 Cited by
  • Summary
  • Abstract
  • Description
  • Claims
  • Application Information

AI Technical Summary

Problems solved by technology

Since there is no clear method for judging the similarity between oil and gas fields, the above two "conventional" methods will undoubtedly be affected by personal subjective consciousness. For

Method used


Image

  • Visualized quantitative evaluation method of oil and gas field similarity
  • Visualized quantitative evaluation method of oil and gas field similarity
  • Visualized quantitative evaluation method of oil and gas field similarity

Examples


specific Embodiment

[0041]The Q oil and gas field is a newly discovered oil field in the Bohai Sea. It is currently in the preliminary research stage of oilfield development. The main development parameters are shown in Table 1:

[0042] Table 1: Main development parameters of Q Oilfield

[0043] parameter name

Permeability

crude oil viscosity

Dissolved gas oil ratio

Porosity

buried deep

Effective thickness

unit

d

mPa.s

m 3 / m 3

f

m

m

parameter value

8222

440

20

0.376

1064

8.3

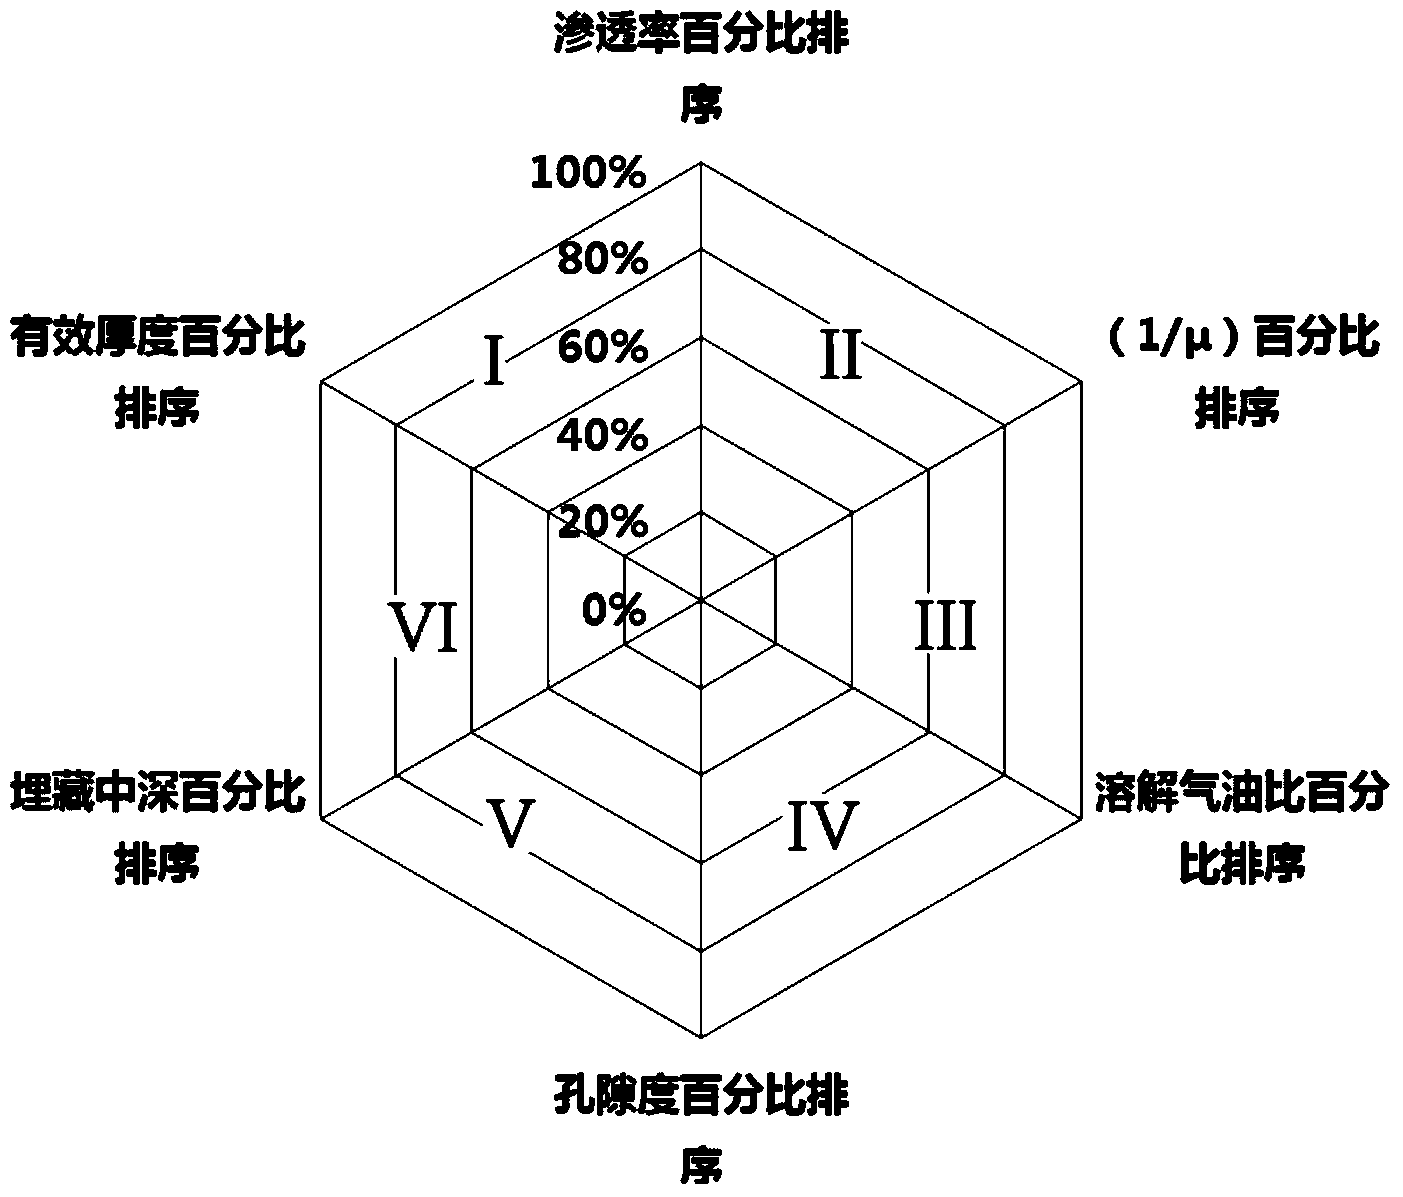
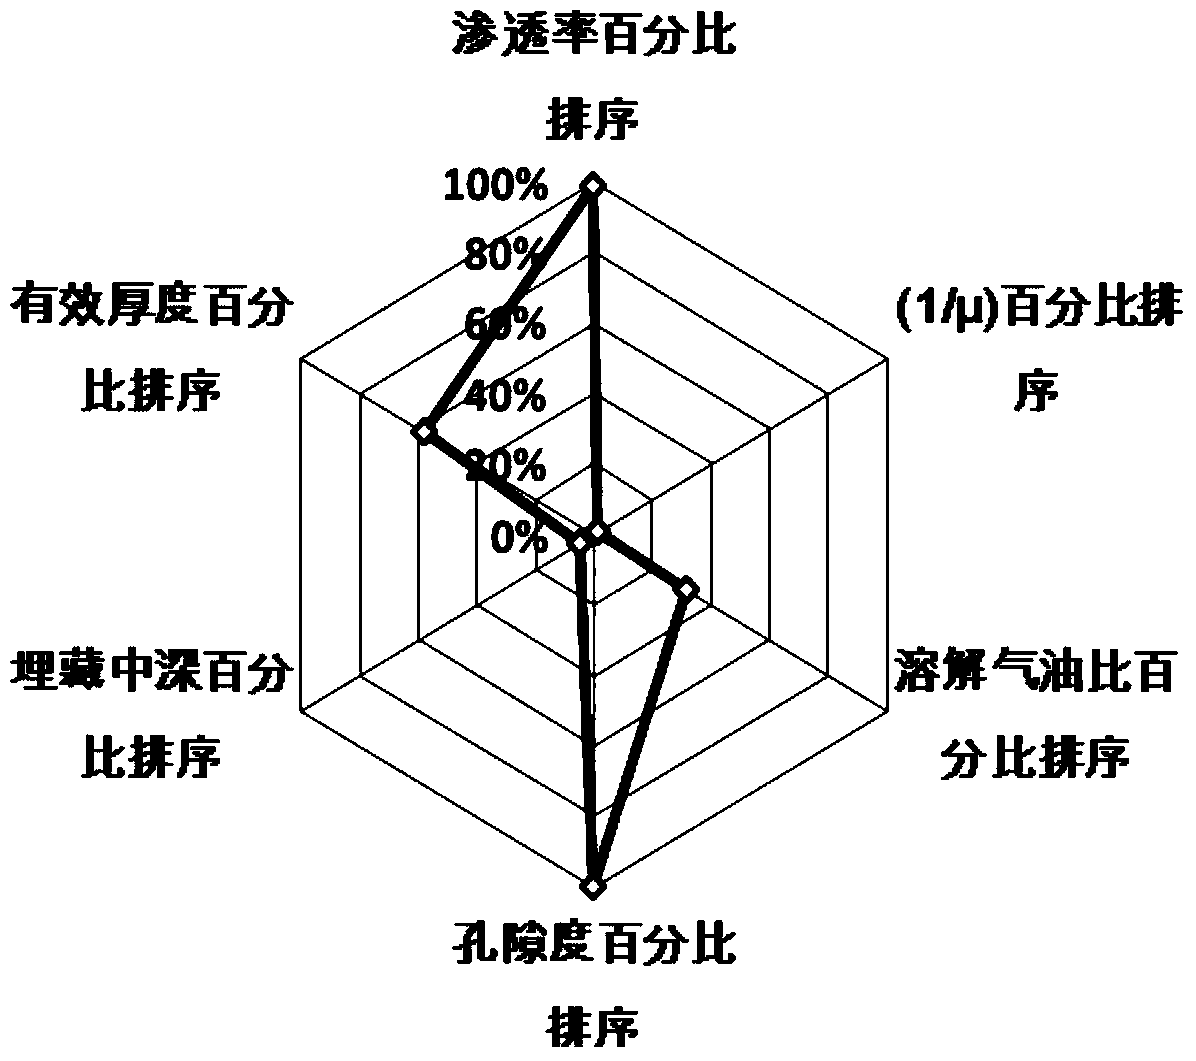
[0044] 1) Calculate the percentage ranking of the six static parameters of the Q oilfield in the 150 developed oil and gas fields in the analogy library, and the calculation results are shown in Table 2:

[0045] Table 2: Percentage ranking table of the six static parameters of Q oilfield in the developed oil and gas fields in the analogy library

[0046]

[0047] 2) According to the calculation results in Table...


PUM


Abstract

The invention relates to a visualized quantitative evaluation method of oil and gas field similarity. The method comprises the following steps that (1) the percentage ranking of six static parameters of a targeted oil and gas field in the similar oil and gas fields is respectively calculated; (2) a radar graph of the percentage ranking of the static parameters of the targeted oil and gas field is drew, a characteristic polygon of the targeted oil and gas field is formed, and the characteristic polygon of the similar oil and gas fields is also drew in the same radar graph; (3) the parameters of which the percentage ranking is lower than 5% are judged and studied, which are also called master control factors of the targeted oil and gas field in the radar graph; (4) the similarity of the targeted oil and gas field and every similar oil and gas field is calculated; (5) when the master control factors exist in the targeted oil and gas field, the oil and gas fields with the same master control factors, with the similarity ranking among the top five and with the similarity higher than 50% are judged as the most similar oil and gas fields, and when the master control factors do not exist in the targeted oil and gas field, the oil and gas fields are judged merely according to the similarity; and (6) the basic data of the similar oil and gas fields determined by the step (5) is output in a form, the radar graph is drew according to the absolute figure of the parameters and analyzed and used by reservoir engineering researchers.

Description

technical field [0001] The invention relates to an evaluation method in the field of oil development, in particular to a visual quantitative evaluation method for similarity of oil and gas fields. Background technique [0002] The analogy method is based on determining the similarity between different objects, and infers the unknown, non-occurring or difficult-to-determine properties of another object by referring to the known, occurred, or relatively clear properties of an object. It is a common method in the exploration and development of oil and gas fields. Due to the invisibility and complexity of the underground conditions, in the geological research of oil and gas field exploration and development, the parameters and experience of developed oil and gas fields with rich development data are often used to predict the parameters of undeveloped or early-stage oil and gas fields. The basis of the analogy method is based on the study of the similarity between the target oil...

Claims


Application Information

Patent Timeline
IPC IPC(8): G06F19/00
Inventor 刘新光丁祖鹏田冀谭先红韩玮玮张金庆朱国金彭世强余华杰张利军田波
Owner CHINA NAT OFFSHORE OIL CORP
Why Eureka
Try Eureka