Methods for positioning and displaying artifact or intensity inhomogeneity in digital image

A digital image, non-uniform technology, applied in the field of image compression, displaying deviation field artifacts and tissue brightness overlapping information, can solve problems such as poor repeatability, difficulty in evaluating deviation field correction results in MRI images, and difficulty in distinguishing brightness

Active Publication Date: 2014-08-13
孙烨
View PDF10 Cites 13 Cited by
  • Summary
  • Abstract
  • Description
  • Claims
  • Application Information

AI Technical Summary

Problems solved by technology

but in figure 2 We can find its flaws: it is difficult for the human eye to distinguish the brightness difference in the area shown by the two circles
Manual segmentation is labor-intensive, and these methods are poorly reproducible and have questionable accura

Method used


Image

  • Methods for positioning and displaying artifact or intensity inhomogeneity in digital image
  • Methods for positioning and displaying artifact or intensity inhomogeneity in digital image
  • Methods for positioning and displaying artifact or intensity inhomogeneity in digital image

Examples


Embodiment 1

[0132] This embodiment applies the present invention to simulated MRI data. The problems solved by the present invention will be described through the embodiment and related reference drawings, the present invention will be verified through simulation data, and how to use the present invention will be explained.

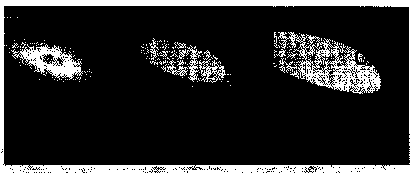
[0133] In this embodiment, the 7th and 8th items and the 1st, 2nd and 6th items of the present invention are jointly applied, and the working principle diagram is shown in Figure 9 . First, the histogram of the decomposed image sequence is used to locate the display interval of the deviation field. In this interval, the original image is sequentially segmented by the sampled threshold sequence to obtain a decomposed image sequence composed of binary images. After color mapping, the color map sequence is obtained. In this way, the spatial variation pattern of the deviation field in the MRI image is displayed (the overlapping information of different tissue brightnes...

Embodiment 2

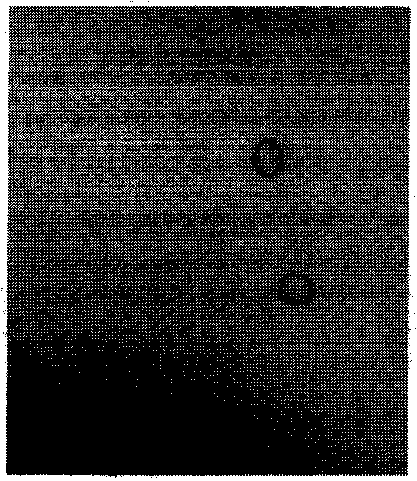
[0146] Embodiment 1 uses the simulated MRI image to verify that the present invention can detect the deviation field, and it is consistent with the objective existence. This embodiment will further illustrate how the present invention accurately displays the non-uniform intensity of the image and reduces the subjective bias of the visual illusion. In the present embodiment will use the 1-2 items of the present invention to show figure 2 The simulated MRI bias field shown (ie Figure 10 C shows the simulated MRI bias field).

[0147] Will figure 2 Shown MRI simulation deviation field image decomposes this image with all threshold value sequences in its brightness range: calculate original image highest brightness level Imax (this embodiment is 221) and minimum brightness level Imin (this embodiment is 58); application threshold {Imax , Imax-1,..., Imin+1, Imin} and formula (1) carry out binary segmentation to the original image in turn, and obtain the decomposed image sequ...

Embodiment 3

[0150] In this embodiment, the method used is the same as in Embodiment 1. The difference is that the images used are from real MRI data, in order to further explain the invention and illustrate its practical application.

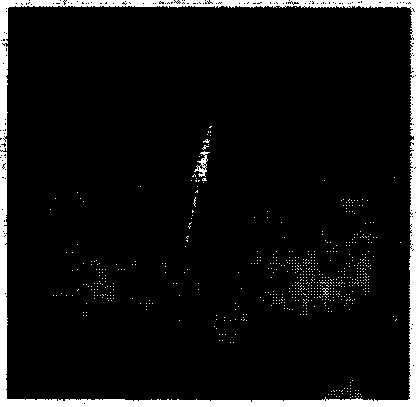
[0151] The images used in this example ( Figure 15 ) is MRI data in real DICOM format and 3T field strength. In this embodiment, the same part as Embodiment 1 is briefly described. The main operation steps are explained as follows:

[0152] An image of interest is read from DICOM format MRI data and stored in a matrix.

[0153] Calculate the maximum value of the image matrix, the maximum value of this image is 2604. Starting from 2604, the original image matrix is ​​thresholded in descending order, and the number of pixels with a value of 1 in the matrix is ​​counted for each level of segmentation, and then stored. Plot a histogram of the decomposed image sequence using the stored vector and the brightness level vector of the image (see Figure 16 ). ...


PUM


Abstract

The invention provides methods for rapidly positioning and displaying weak artifacts or intensity inhomogeneity in an image and detecting brightness distribution overlapping information of different targets in the image on the basis of brightness decomposition of the digital image. A decomposition image sequence and a histogram thereof are used to provide two methods for positioning display sections of the artifacts or the intensity inhomogeneity in the image. Through the sampled decomposition image sequence, the brightness range of a target of interest in the image can also be rapidly searched for and the method is simple and easy to realize. The property of the decomposition image sequence and a color mapping method are used to improve the precision of displaying the artifacts or the intensity inhomogeneity and reduce subjective deviations of visual illusion and the like. The new methods can be used for assessing the artifacts or the intensity inhomogeneity in the image and a correction method of the artifacts or the intensity inhomogeneity, or detecting the defects of an imaging object, and can also be used for retrieving brightness information of the image and positioning a brightness range of the target of interest. The decomposition image sequence histogram can also be used for rough dividing, background noise estimation or inhibition of the image or image compression.

Description

technical field [0001] The invention relates to a method for locating and displaying artifacts or non-uniform intensity in a digital image, a method for detecting overlapping brightness ranges between different objects in an image, and a specific method for displaying deviation field artifacts and tissue brightness overlapping information in magnetic resonance images. It also involves image segmentation method, background noise estimation and suppression method, and image compression method in the field of image processing. [0002] Note: In this manual, intensity is synonymous with image brightness or grayscale. Background technique [0003] As an example in the field of medical imaging, the main content of the present invention will be described through the display and positioning of deviation field artifacts and tissue overlapping information in magnetic resonance images. [0004] The bias field (or intensity inhomogeneity) is a kind of artifact in Magnetic Resonance Ima...

Claims


Application Information

Patent Timeline
IPC IPC(8): G06T7/00G06T5/50
Inventor 孙烨
Owner 孙烨
Why Eureka
Try Eureka