
MapX-based GIS bus information visualization method

A technology for public transport information and public transport, applied in special data processing applications, instruments, electrical digital data processing, etc., can solve problems such as poor dispatch control ability and low operation efficiency, and achieve convenient decision-making, guarantee sustainable operation, and facilitate planning. Effect

Inactive Publication Date: 2014-09-10
SICHUAN UNIV
View PDF2 Cites 10 Cited by
  • Summary
  • Abstract
  • Description
  • Claims
  • Application Information

AI Technical Summary

Problems solved by technology

At the same time, there are also deficiencies, such as: poor scheduling and control capabilities, and low operational efficiency

Method used


Image

  • MapX-based GIS bus information visualization method
  • MapX-based GIS bus information visualization method
  • MapX-based GIS bus information visualization method

Examples


Embodiment Construction

[0044] The present invention will be further described below in conjunction with the accompanying drawings.

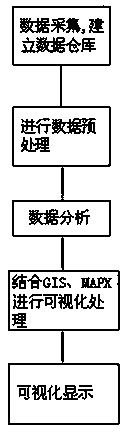
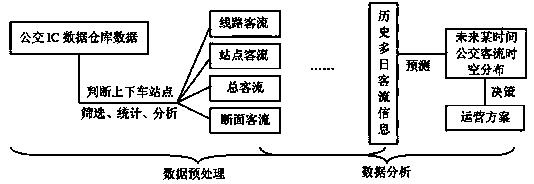
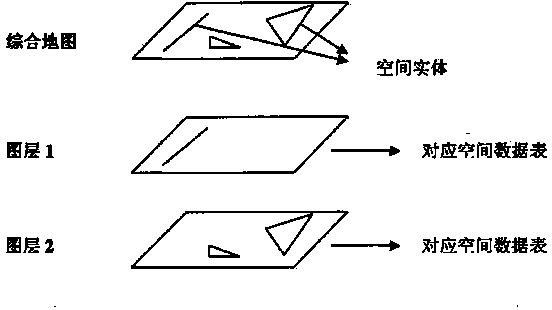
[0045] Such as figure 1 , 2 As shown in , 3, a GIS bus information visualization method based on MapX, the vehicle-mounted terminal system collects dynamic bus IC card data and static bus station and bus line information downloaded from the bus network, and establishes a data warehouse. IC card data includes card number, consumption amount, card balance, consumption date, consumption time, line number, vehicle number, boarding station and alighting station information; bus station information includes station location, station number and distance between adjacent stations; The bus line information includes line number, station name, station number, station number, starting station location, terminal station location and intermediate station location.

[0046] Preprocess the data in the data warehouse, that is, filter and clean up redundant data, and retain the data o...


PUM


Abstract

The invention discloses a MapX-based GIS bus information visualization method, belongs to the technical field of bus information visualization and solves the problems that in the prior art, the regulating intensity of bus operation is poor, and operating efficiency is low. The method includes acquiring dynamic bus IC card data and static station information and line information, and establishing a data warehouse; preprocessing the data in the data warehouse, and retaining the required data; analyzing the preprocessed bus IC card data by the data analysis method, and acquiring the passenger flow distribution information; establishing a data model by GIS through the MapX spatial data structure, and implementing visualization display of the passenger flow distribution information through a program. The method has the advantages that bus information visualization can be implemented, bus station planning can be benefited, public traffic information management service level can be raised, the bus line network can be arranged reasonably, bus operation plan can be made scientifically, and the sustainable operation of the public traffic can be guaranteed.

Description

technical field [0001] A GIS public transport information visualization method established based on MapX, which realizes the public transport information visualization, belongs to the technical field of public transport information visualization. Background technique [0002] With the substantial growth of population, urban transportation is facing increasing pressure. This problem is common in all large and medium-sized cities in the world, and many countries have proposed many methods to solve the traffic congestion problem, and even become a scientific research topic. Especially in recent years, the increase of private cars has made the already congested traffic even worse. Although many cities have adopted one-way lanes, or measures for traveling with odd and even license plate numbers, the time people spend on the road when commuting to and from get off work is still on the rise. trend. As a major means of transportation, public transportation has undoubtedly become th...

Claims


Application Information

Patent Timeline
Patent Type & Authority Applications(China)
IPC IPC(8): G06F17/30G06F17/50
CPCG06F16/248
Inventor 张海仙章毅吕建成张蕾彭德中桑永胜郭际香毛华
Owner SICHUAN UNIV
Learn More