Network flow abnormity analysis method based on visualization clustering

A network traffic and clustering technology, applied in data exchange networks, digital transmission systems, electrical components, etc., can solve the problems that users are difficult to understand and use, consume a lot of time, and cannot interact.

Active Publication Date: 2015-03-04
CENT SOUTH UNIV
View PDF4 Cites 25 Cited by
  • Summary
  • Abstract
  • Description
  • Claims
  • Application Information

AI Technical Summary

Problems solved by technology

[0003] Due to the massive and high-dimensionality of network traffic data, traditional data mining techniques and algorithms are difficult for users to understand and use, often consuming a lot of time, and fail to analyze the relationship between data clearly to reflect the complete network status. The user interacts with the driver

Method used


Image

  • Network flow abnormity analysis method based on visualization clustering
  • Network flow abnormity analysis method based on visualization clustering
  • Network flow abnormity analysis method based on visualization clustering

Examples


Embodiment Construction

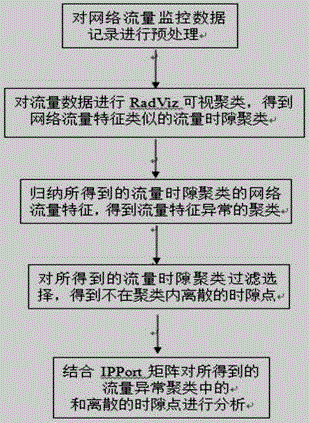
[0043] The invention discloses a method for abnormal analysis of network traffic based on visual clustering, see figure 1 , including five main steps: 1) Preprocessing the network traffic monitoring data records; 2) Carrying out RadViz visual clustering on the traffic data to obtain traffic time-slot clusters with similar network traffic characteristics; 3) Summarizing the results obtained in 2) The network traffic characteristics of the traffic time slot clustering, obtain the abnormal clustering of traffic characteristics; 4) to 2) the flow time slot clustering filter selection obtained, obtain the discrete time slot points not in the cluster; 5) combine IPPort The matrix analyzes the flow anomaly clusters and discrete time slot points obtained in 3) and 4). The present invention can quickly perform collaborative filtering on network traffic in combination with multiple angles, and efficiently analyze the abnormality of network traffic.

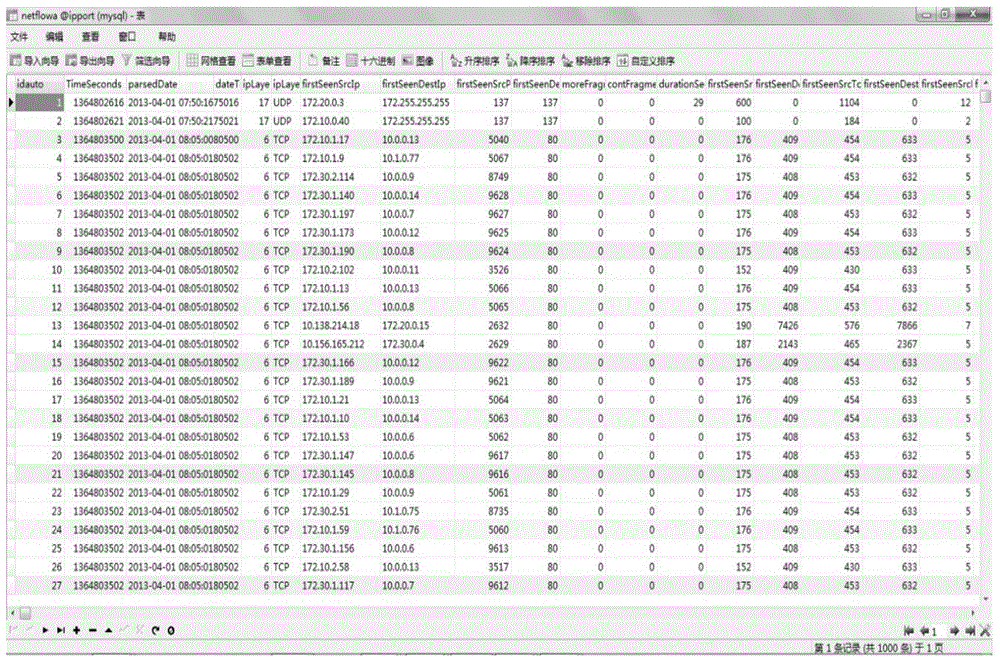
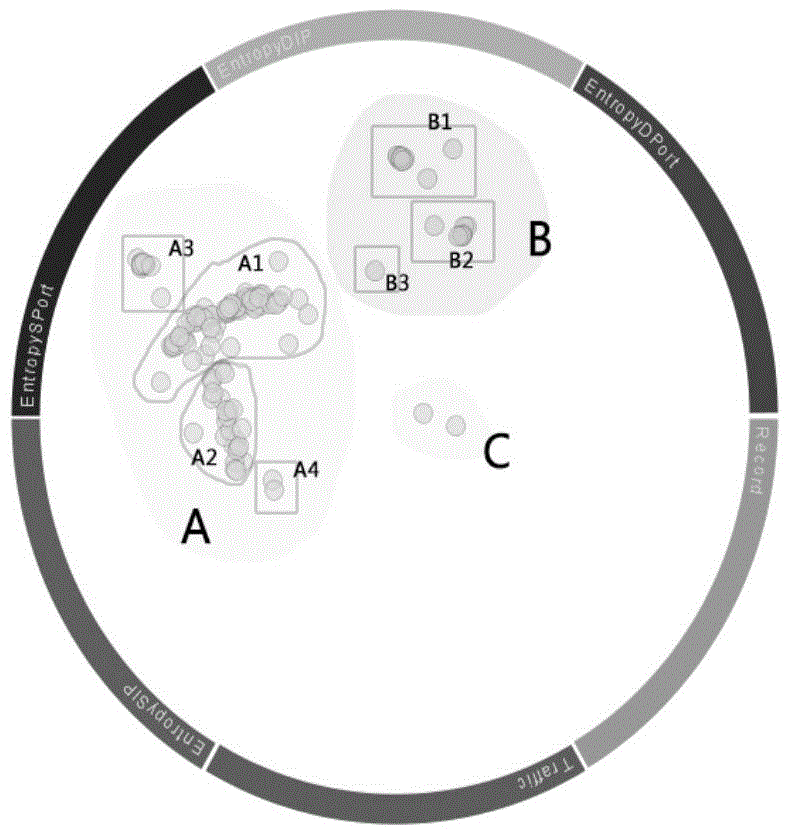
[0044] see figure 2 , utilize the...


PUM


Abstract

The invention discloses a network flow abnormality analysis method based on visualization clustering. The method comprises the steps: 1) pre-treating monitoring data record of network flow; 2) performing RadViz visualization clustering to the flow data to obtain similar flow time-slot clustering of the network flow features; 3) concluding network flow features of the flow time-slot clustering obtained in the step 2) to obtain abnormal clustering of the network flow features; 4) filtering and choosing the flow time-slot clustering obtained in the step 2) to obtain time-slot points which are discrete in the clustering; and 5) analyzing the time-slot points and the discrete time-slot points in the abnormal flow clustering obtained in the steps 3) and 4) in combination of IPPort matrix. According to the network flow abnormality analysis method based on visualization clustering, the collaborative filtering of the network flow can be performed rapidly in multiple perspectives and the abnormity of the network flow can be analyzed efficiently.

Description

technical field [0001] The invention relates to a network traffic anomaly analysis method based on visual clustering. Background technique [0002] Traffic is the amount of data transmitted in the network. Data transmission is the basis of network activities. Network traffic is one of the most important symbols of network activities. Almost all network applications and network attacks can be traced in traffic changes. Now that the information society has entered the era of big data, the scale of the network is growing day by day, the degree of equipment integration is getting higher and higher, the data capacity is getting bigger and bigger, emerging network services are being gradually developed, and network traffic is growing explosively. Network status. [0003] Due to the massive and high-dimensionality of network traffic data, traditional data mining techniques and algorithms are difficult for users to understand and use, often consuming a lot of time, and fail to anal...

Claims


Application Information

Patent Timeline
Patent Type & Authority Applications(China)
IPC IPC(8): H04L12/24
Inventor 周芳芳王俊韡赵颖彭燕妮施荣华樊晓平
Owner CENT SOUTH UNIV
Why Eureka
Try Eureka