Preparation method of network statistical map visualized data

A technology for map data and network statistics, which is applied in the fields of electrical digital data processing, special data processing applications, and computing, and can solve problems such as whether network maps are good-looking or not.

Inactive Publication Date: 2015-03-11
WUHAN UNIV
View PDF6 Cites 17 Cited by
  • Summary
  • Abstract
  • Description
  • Claims
  • Application Information

AI Technical Summary

Problems solved by technology

The network map made by this kind of met

Method used


Image

  • Preparation method of network statistical map visualized data
  • Preparation method of network statistical map visualized data

Examples


Embodiment Construction

[0032] The technical solutions of the present invention will be further specifically described below through the embodiments and in conjunction with the accompanying drawings.

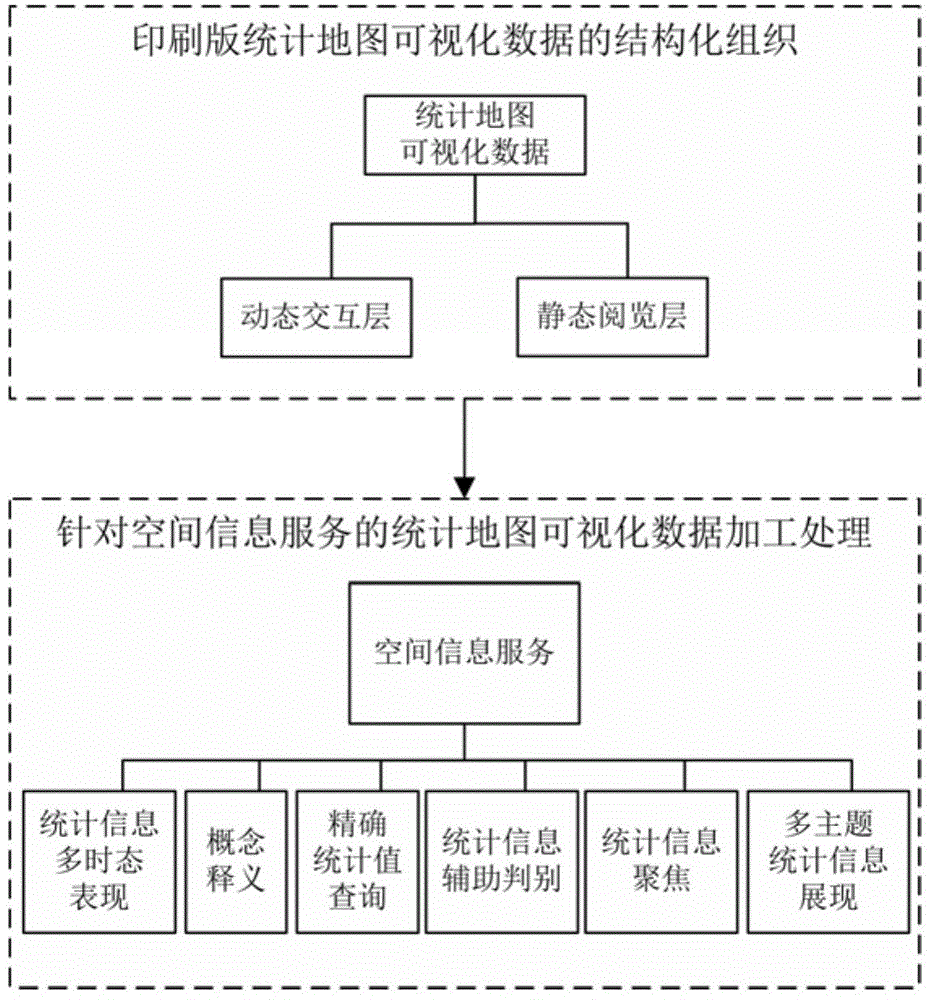
[0033] The embodiment provides a method for preparing visualized data of a network statistical map, which mainly includes the following steps:

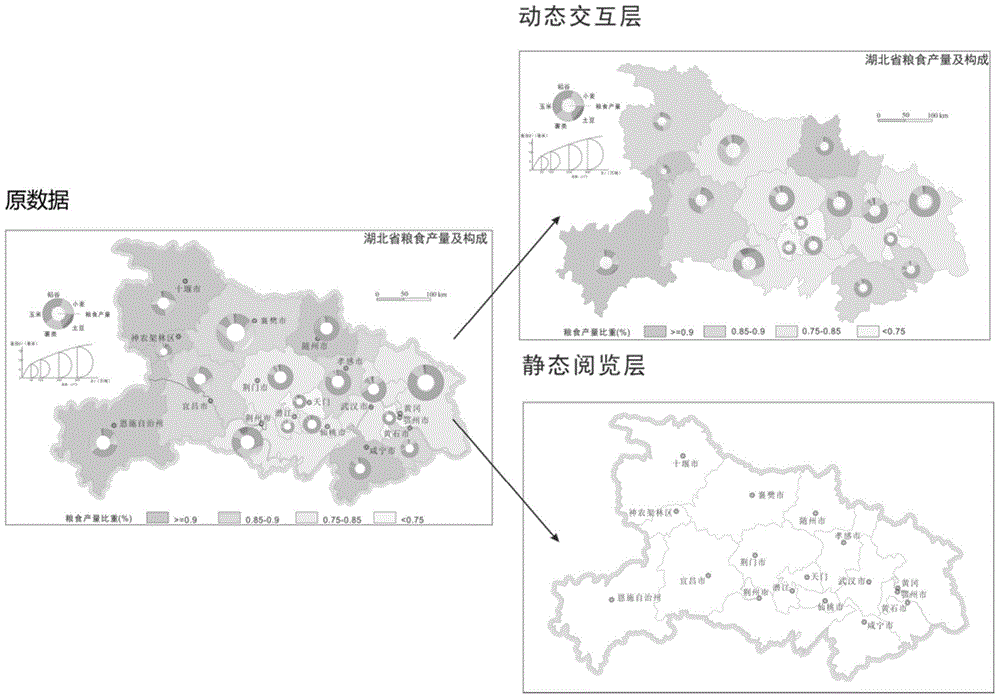
[0034] Step 1, the structured organization of printed statistical map visualization data. Divide the visual data of the printed statistical map into a dynamic interactive layer and a static reading layer. The dynamic interaction layer is a collection of data representing statistical information in the statistical map visualization data, including: Symbolic and graphical data representing statistical information, legend data, Image title data. The static reading layer is a collection of data representing non-statistical information in the statistical map visualization data, including: data in the basemap section, Chart data used as a graph...


PUM


Abstract

The invention relates to the field of network map visualization and spatial information services and in particular relates to a preparation method of network statistical map visualized data. The preparation method comprises the steps of firstly, structurally organizing the printing plate statistical map visualized data and dividing the data into a dynamic interaction layer and a static reading layer, and secondly, aiming at the spatial information services, processing the statistical map visualized data, adding Javascript script to the SVG data obtained by virtue of conversion in the last step to support the spatial information services, wherein the spatial information services include statistical information multi-tense show, concept interpretation, accurate statistical inquiry, statistical information auxiliary discrimination, statistical information focusing and multi-topic statistical information shown. The network statistical map visualized data prepared by use of the preparation method of the network statistical map visualized data are easy to use, can be directly used for reading under a network browser after being embedded into an HTML document, and further are capable of supporting the spatial information services.

Description

technical field [0001] The invention relates to the field of network map visualization and spatial information service, in particular to a method for preparing network statistical map visualization data. Background technique [0002] Map visualization is an important part of data visualization. Statistical data can be used to reflect the characteristics of visualized objects. Statistical information is often expressed by hierarchical statistical charts, zonal statistical charts or a combination of the two, which are used to express the characteristics of various social and economic phenomena. Size, level, structure, distribution, interdependence and development trends. Driven by new technologies such as computers (information processing) and networks (communication and exchange), the form, content and types of traditional media have changed. The transition from the mode of media communication to the mode of communication of new network media has correspondingly put forward ...

Claims


Application Information

Patent Timeline
IPC IPC(8): G06F17/30
CPCG06F16/212G06F16/248
Inventor 田晶刘耀林艾廷华周梦杰赵荣熊富全
Owner WUHAN UNIV
Why Eureka
Try Eureka