A trend graph display method for on-line vibration monitoring of rotating machinery

A technology for vibration monitoring and rotating machinery, which is applied in measuring devices, special data processing applications, and measuring ultrasonic/sonic/infrasonic waves, etc. It can solve the problems of no curve layout optimization, comparative analysis, and inability to visualize trend curves, etc., and achieve trend curves The effect of the graph is intuitive and convenient for data comparison

Active Publication Date: 2018-04-24
HUAZHONG UNIV OF SCI & TECH
View PDF4 Cites 0 Cited by
  • Summary
  • Abstract
  • Description
  • Claims
  • Application Information

AI Technical Summary

Problems solved by technology

However, the existing trend graph display methods are simply extracting data and drawing curves, without screening or calculating the data, and without reasonable optimization of the curve layout, which cannot make the trend graph intuitive, clear, and convenient for comparison and analysis

Method used


Image

  • A trend graph display method for on-line vibration monitoring of rotating machinery
  • A trend graph display method for on-line vibration monitoring of rotating machinery
  • A trend graph display method for on-line vibration monitoring of rotating machinery

Examples


Embodiment Construction

[0026] In order to make the object, technical solution and advantages of the present invention clearer, the present invention will be further described in detail below in conjunction with the accompanying drawings and embodiments. It should be understood that the specific embodiments described here are only used to explain the present invention, not to limit the present invention. In addition, the technical features involved in the various embodiments of the present invention described below can be combined with each other as long as they do not constitute a conflict with each other.

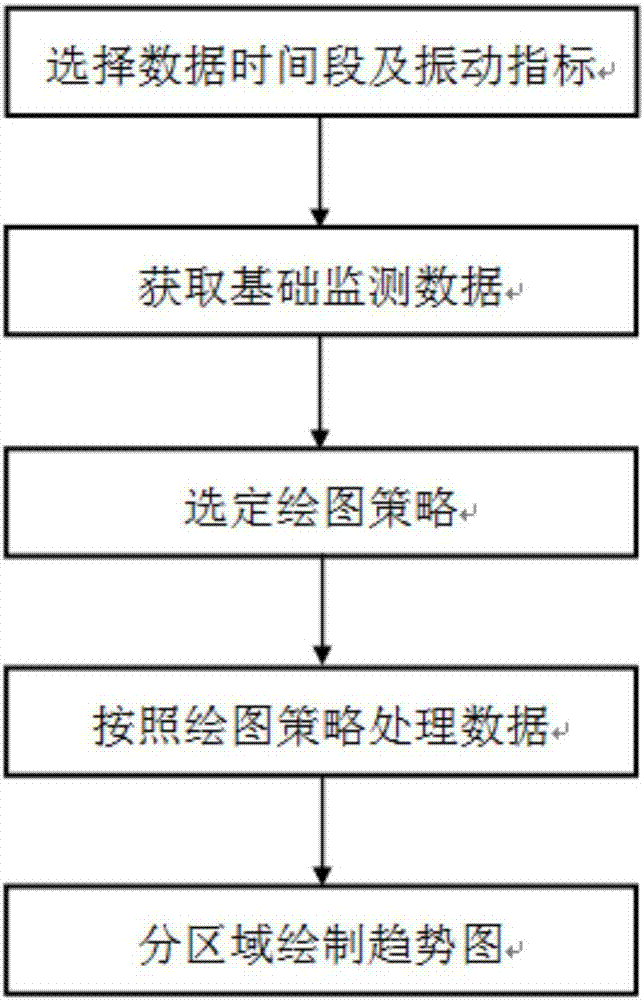
[0027] refer to figure 1 , the method for displaying trend graphs for on-line vibration monitoring of rotating machinery includes the following:

[0028] 1) Select the data time period and vibration index;

[0029] The data time period can be selected to obtain the latest period of time and automatically update the time period. For example, the data time period is the latest 8 hours from the p...


PUM


Abstract

The invention discloses a trend graph display method for on-line vibration monitoring of rotating machinery, comprising the following steps: 1) selecting a data time period and vibration index; 2) reading basic monitoring data in a database; 3) selecting a drawing Strategy: Draw the basic monitoring data according to the point set density or according to the statistical strategy; 4) Draw the trend curve in the sub-coordinate system. The present invention acquires basic monitoring data by selecting data time periods and vibration indicators, selects a drawing strategy, processes the data according to the drawing strategy, and draws a trend graph for the processed score area. In the process of generating the trend curve, the present invention adds data processing, including data screening and calculation, so that the trend curve is more intuitive and clear; in the process of displaying again, it is displayed in different regions, which is convenient for data comparison.

Description

technical field [0001] The invention belongs to the technical field of vibration monitoring, in particular to a trend graph display method for on-line vibration monitoring of rotating machinery. Background technique [0002] Rotating machinery is widely used in various industries. At the same time, it is developing towards large-scale and complex. Once a failure occurs, it will cause huge losses and even cause major safety accidents. Therefore, online vibration monitoring for it is very important. The trend graph can observe the change trend or actual situation of the equipment status, which is helpful to discover equipment abnormalities in advance and take timely countermeasures. [0003] At present, the technology of drawing trend graphs based on monitoring data is relatively mature and has been widely used in vibration monitoring systems. However, the existing trend graph display methods simply extract data and draw curves without screening or calculating the data, and w...

Claims


Application Information

Patent Timeline
Patent Type & Authority Patents(China)
IPC IPC(8): G06F17/50G01H17/00
Inventor 杨涛郭盛张琛黄树红高伟钟龙张伟鹏李存文王政航
Owner HUAZHONG UNIV OF SCI & TECH
Why Eureka
Try Eureka