
Image analysis method of weaving density of woven fabrics based on multi-scale and multi-region

An image analysis and weaving density technology, applied in the field of image analysis of yarn weaving density, can solve the problems of affecting steps and results, large amount of computation, and difficulty in accurately distinguishing the arrangement period of the yarn arrangement period.

Inactive Publication Date: 2017-08-01
ZHEJIANG COLLEGE OF ZHEJIANG UNIV OF TECHOLOGY
View PDF3 Cites 0 Cited by
  • Summary
  • Abstract
  • Description
  • Claims
  • Application Information

AI Technical Summary

Problems solved by technology

However, this method has the following main defect: this method is only suitable for analyzing the yarn weaving density of single-color fabrics, because the yarn color arrangement of multi-color fabrics may form a certain periodicity in the power spectrum diagram Information feature points, so that it is difficult to accurately distinguish the arrangement period of some colored yarns and the arrangement period of all yarns
This method provides a new way of thinking for collecting fabric yarn information and segmenting deformed yarns, but it has the following main disadvantages: (1) The accuracy and stability of the solution of the grid model have a great impact on the initial yarn positioning results. Sensitive; (2) The analysis area processed by this method only contains a relatively small area, because if it is extended to multiple areas, the calculation amount of this method will be very large
The main disadvantage of this method is that it relies too much on the color segmentation results of the yarns in the fabric. When the colors of the two yarns are close (for example, two reds with close brightness information), it is difficult for the color clustering method to correctly distinguish the different yarn interweaving area, thereby affecting the steps and results used in subsequent analyses.

Method used


Image

  • Image analysis method of weaving density of woven fabrics based on multi-scale and multi-region
  • Image analysis method of weaving density of woven fabrics based on multi-scale and multi-region
  • Image analysis method of weaving density of woven fabrics based on multi-scale and multi-region

Examples


Embodiment 1

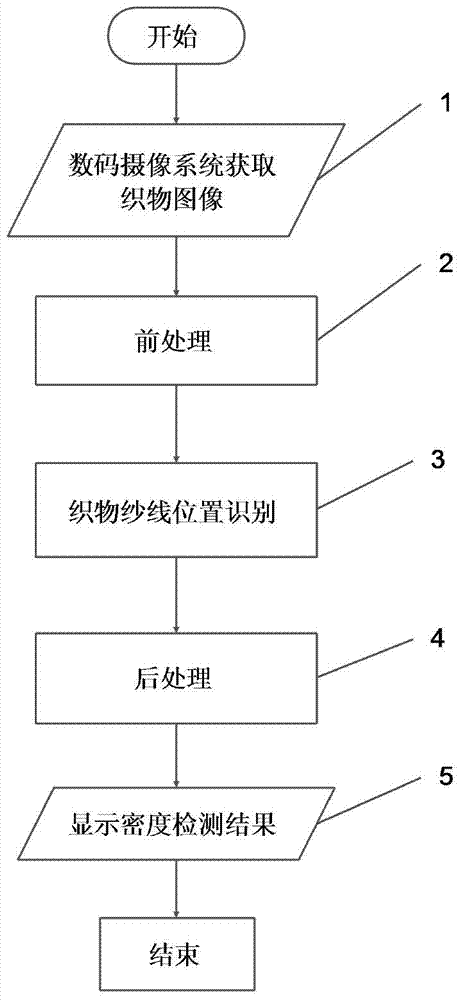
[0050] Such as figure 1 As shown, a kind of image analysis method of the weaving density of the woven fabric based on multi-scale and multi-area of ​​the present embodiment: comprises the following steps: 1) utilizes the charge-coupled device (CCD) digital camera system to obtain the color image of the fabric, the acquired fabric image The color of each pixel in is represented by three color components of red (R), green (G), and blue (B), and the range of each color component value is [0,255].

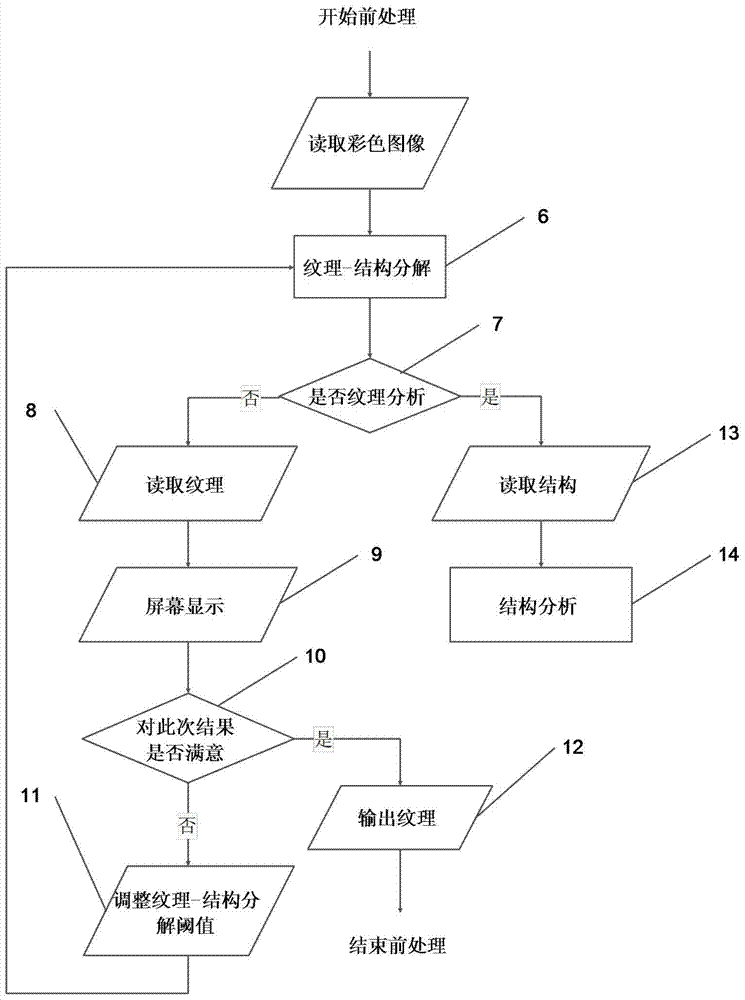
[0051] 2) Pre-processing, used to extract the features of the fabric to be detected under the large-scale view, including the texture information and structural information of the fabric image; such as figure 2 As shown, A) Read the color image of the RGB format of the woven fabric and convert it to the NTSC color space. The image of the woven fabric after the format conversion is described by brightness, hue and saturation information, and is represented by the components Y, I, and Q...


PUM


Abstract

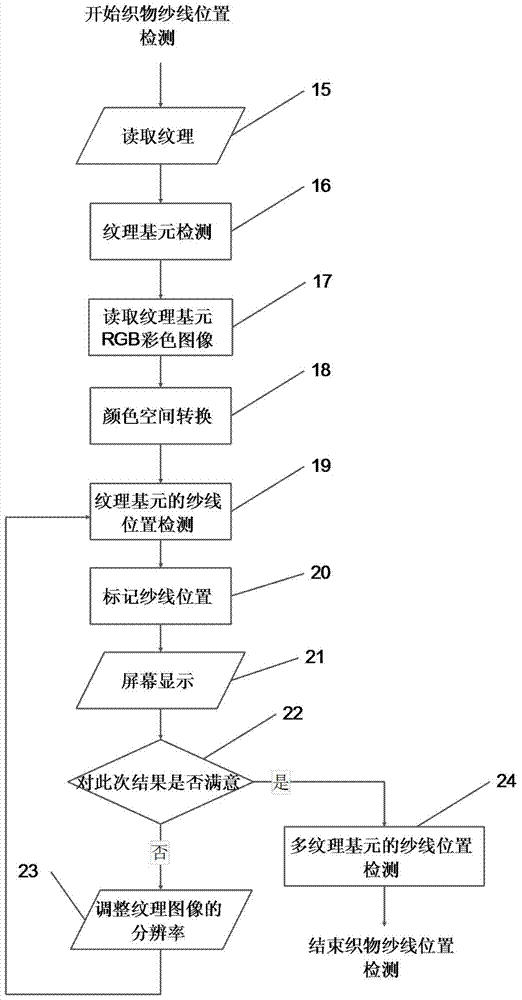
The invention discloses an image analysis method based on multi-scale and multi-zone woven fabric knitting tightness. The method comprises the steps that (1) a digital photography system obtains a fabric image; (2) pretreatment is carried out, wherein the woven fabric image is subjected to structure-grain analysis; (3) woven fabric yarn position detecting is carried out, wherein the fabric grain image output during pretreatment is read, grain elements in a large-scale image of the woven fabric are detected through a similar rule grain model; and (4) post-treatment is carried out, wherein the yarn position detecting results of grain elements extracted by multiple times are subjected to statistics in a two-dimension grid arraying direction, according to multi-zone grain element zone position information, yarn mean density is determined, a user processes a density detecting process of a certain batch, and according to the detecting results of similar rule grain, the accuracy of the mean density detecting results is judged. The efficiency and the accuracy of fabric knitting tightness are improved, and the method is close to a fabric density analysis method in practical production.

Description

technical field [0001] The invention relates to an image analysis method of yarn weaving density in fabrics, more precisely, relates to an image analysis method of weaving density of yarns on the surface of a fabric under multi-scale views and in multiple yarn interweaving regions. Background technique [0002] In the process of producing woven fabrics, technicians need to analyze the weaving density parameters of the fabric samples to determine the weaving parameters on the machine. Traditional analysis methods rely on simple tools, such as magnifying glasses and scales, to use the human eye to identify the number of threads in different areas of the fabric. Usually, in order to ensure the detection accuracy, analysts need to select at least two areas with different contents, the area size is generally about 10×10cm, identify each area at least twice according to the warp and weft directions, and then use the identified warp and weft yarns The average value of the number o...

Claims


Application Information

Patent Timeline
Patent Type & Authority Patents(China)
IPC IPC(8): G06T7/00G06T7/44
CPCG01N21/8983
Inventor 郑德均夏颖翀
Owner ZHEJIANG COLLEGE OF ZHEJIANG UNIV OF TECHOLOGY
Learn More