
Method for detecting sucrose content distribution in peanuts based on hyperspectral imaging technology

A hyperspectral imaging and hyperspectral technology, applied in the direction of color/spectral characteristic measurement, etc., can solve the problem of detecting peanut sucrose and so on

Active Publication Date: 2018-06-26
INST OF AGRO FOOD SCI & TECH CHINESE ACADEMY OF AGRI SCI
View PDF6 Cites 0 Cited by
  • Summary
  • Abstract
  • Description
  • Claims
  • Application Information

AI Technical Summary

Problems solved by technology

However, the research mainly focuses on the purity of seeds. So far, there is no report on the detection of peanut sucrose content distribution using hyperspectral imaging technology at home and abroad.

Method used


Image

  • Method for detecting sucrose content distribution in peanuts based on hyperspectral imaging technology
  • Method for detecting sucrose content distribution in peanuts based on hyperspectral imaging technology
  • Method for detecting sucrose content distribution in peanuts based on hyperspectral imaging technology

Examples


Embodiment 1

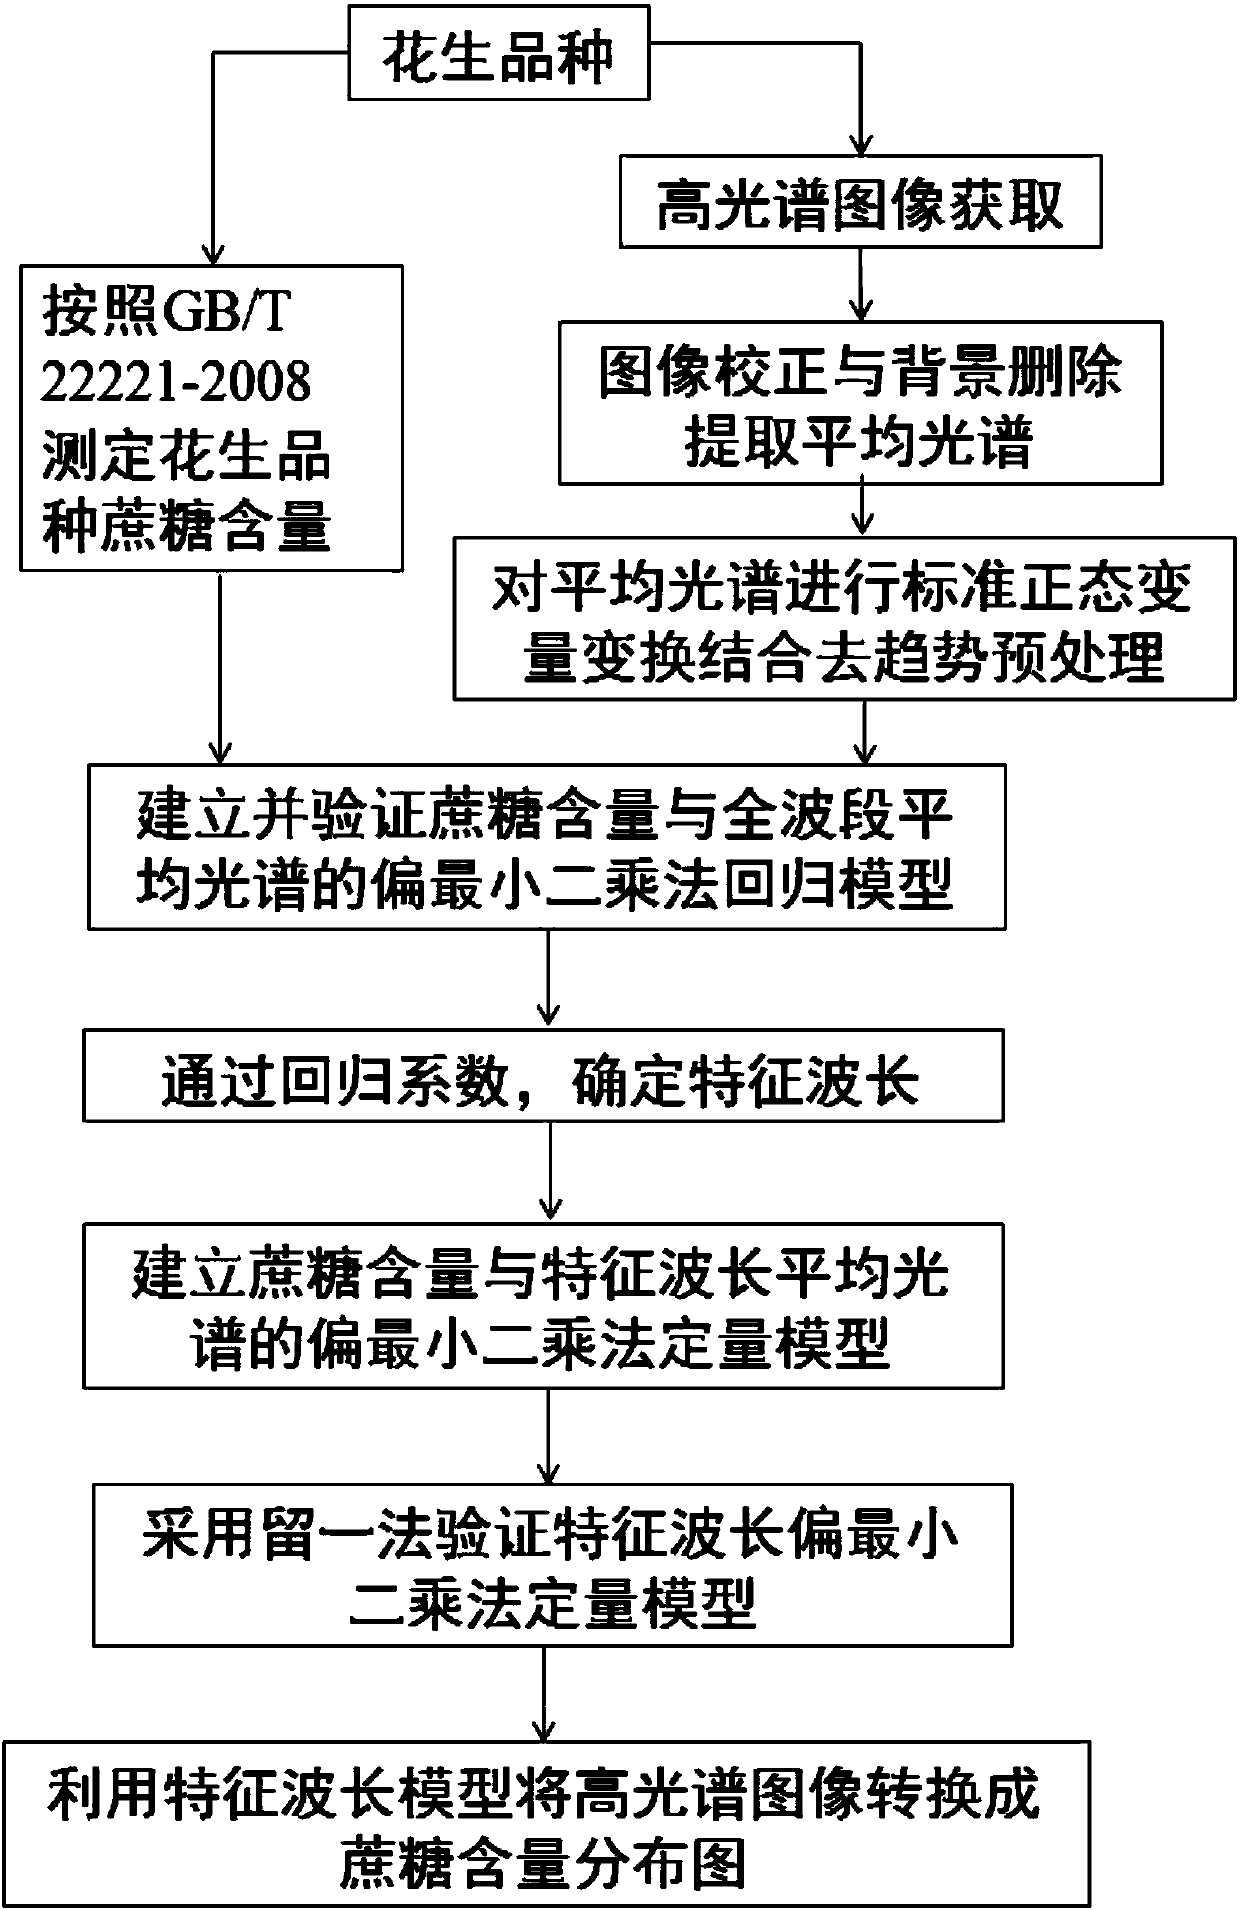
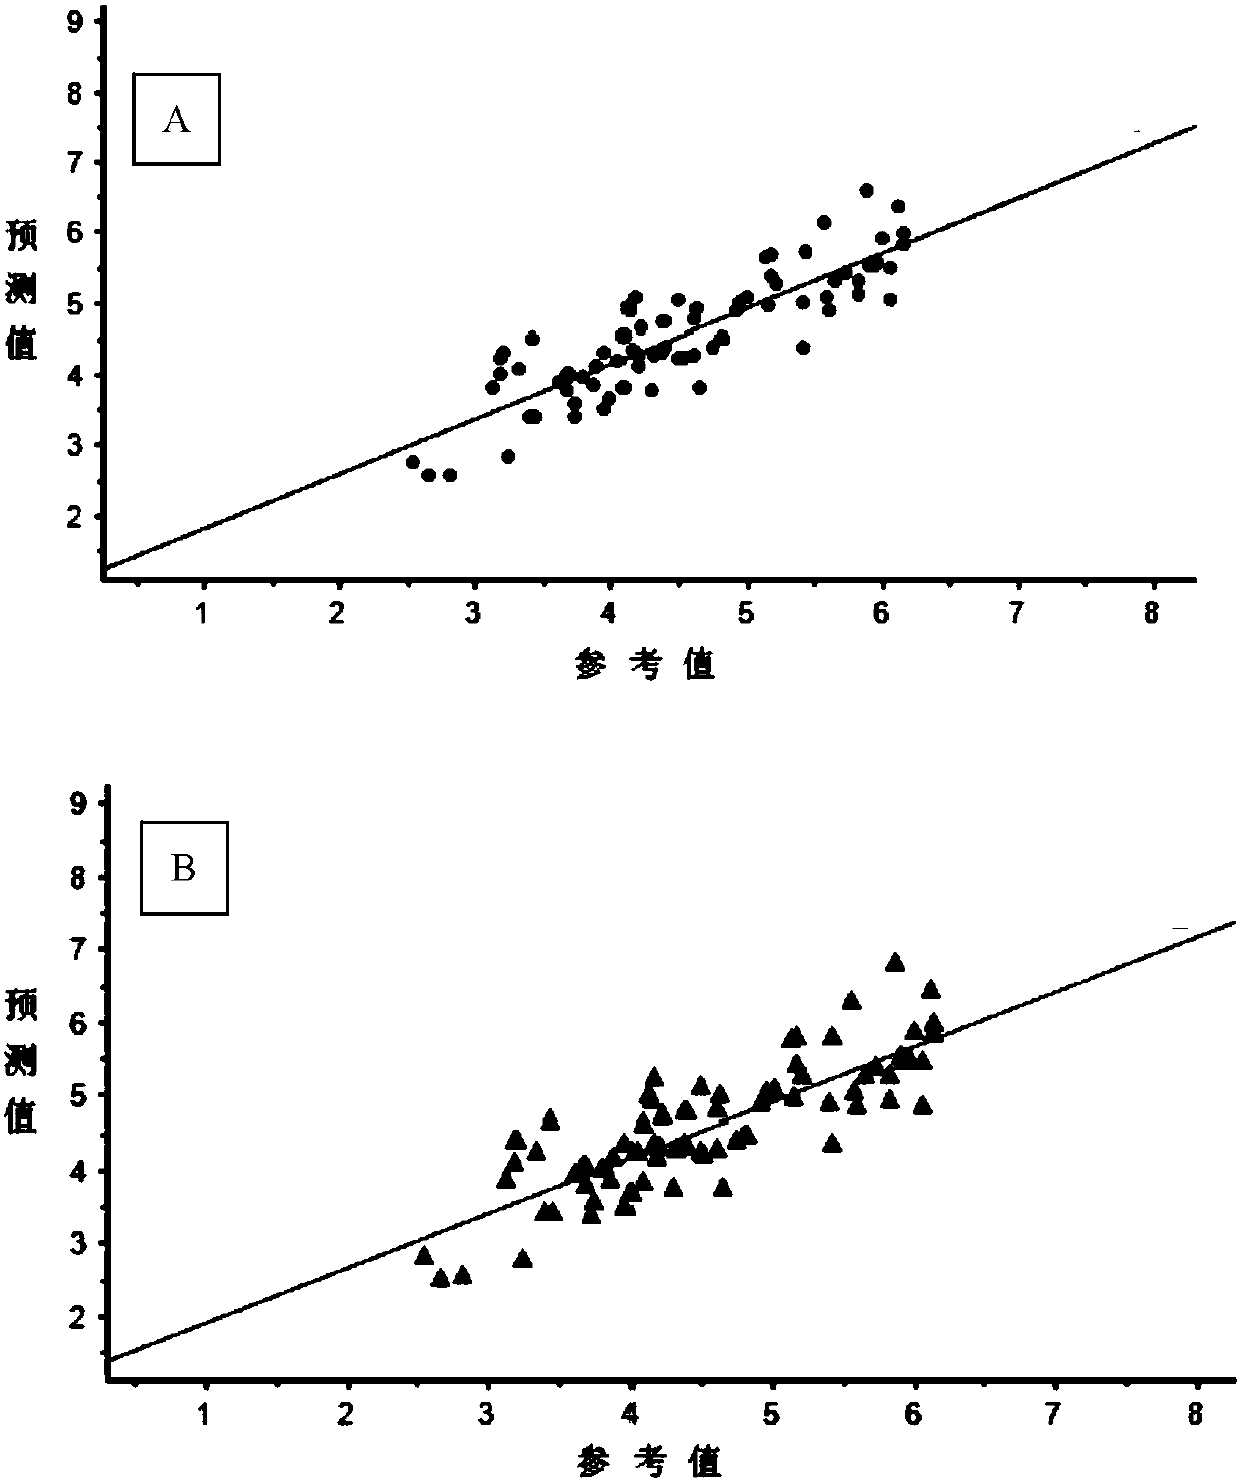
[0072] The present embodiment provides a method for establishing a quantitative model of sucrose content distribution in peanuts based on hyperspectral imaging technology, the method comprising the following steps:

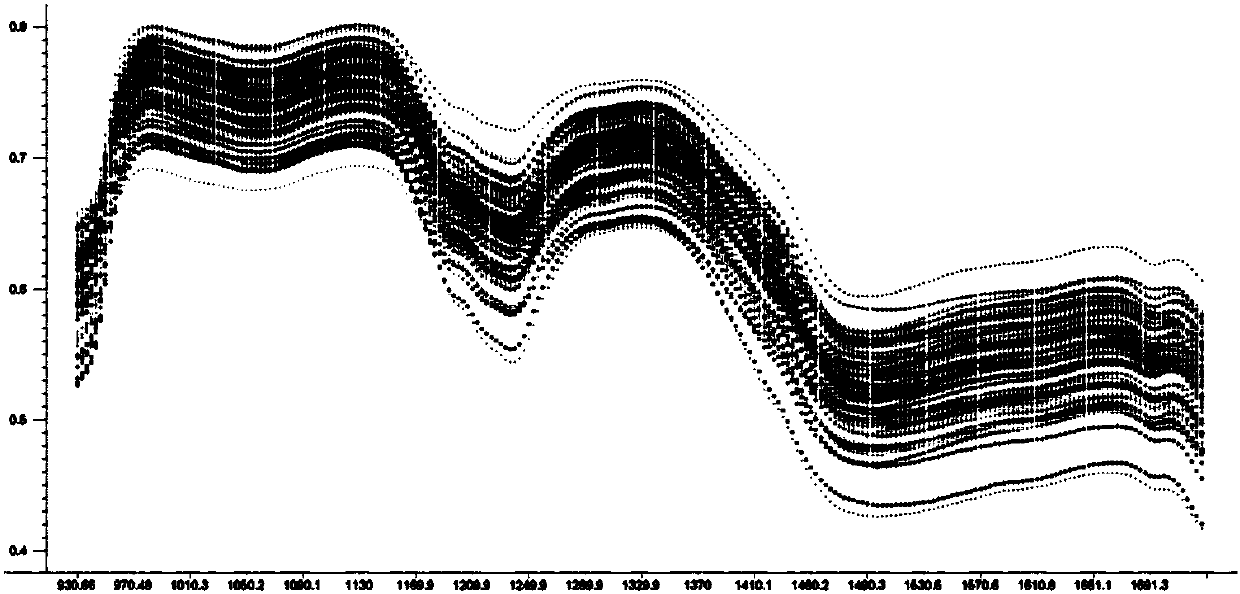
[0073] 1.1 Collect 80 varieties of peanut samples mainly planted in my country's main planting provinces in 2013 and 2014, select 30 complete peanut kernels from each variety, and use a hyperspectral instrument to scan at the same time to obtain images of each pixel in the peanut sample at each wavelength information, repeat 3 times, and take the average value of the hyperspectral images scanned for 3 times. The original hyperspectral 3D image of the peanut sample was obtained. Before each scan, collect a full white calibration image I white and all-black calibration image I dark .

[0074] 1.2 After correcting and deleting the background of the original hyperspectral three-dimensional image of the above-mentioned peanut sample, extract the average spectrum of t...

Embodiment 2

[0098] This embodiment provides a method for detecting the distribution of sucrose content in peanuts based on hyperspectral imaging technology, the method comprising the following steps:

[0099] 1) Collect the spectral images of the peanut samples to be tested at the following characteristic wavelengths: 964nm, 1017nm, 1067nm, 1170nm, 1200nm, 1233nm, 1293nm, 1420nm, 1457nm, 1634nm;

[0100] Specific process: Take another 6 peanut varieties, use the hyperspectral instrument to obtain the original hyperspectral three-dimensional image of the peanut sample in the same way as in Example 1; then use the same method as in Example 1 to extract the average spectrum of the peanut sample image; The average spectrum of the images of the 6 peanut samples was subjected to standard normal variable transformation combined with detrending preprocessing; finally, the spectral images of the 6 peanut samples at the above characteristic wavelengths were obtained.

[0101] 2) Input the spectral ...


PUM

PropertyMeasurementUnit
wavelengthaaaaaaaaaa

Abstract

The invention provides a hyperspectral imaging technology-based method for detecting sucrose content distribution of peanut. The method comprises the following steps: acquiring spectrum images at characteristic wavelengths of a peanut sample, inputting pretreated spectral reflectance at the characteristic wavelengths into a peanut sucrose content distribution quantitative model, and obtaining a peanut sample sucrose content distribution. The invention also provides a method for establishing a peanut sucrose content distribution quantitative model. The method comprises the following steps: acquiring hyperspectral images of peanut, and determining sucrose content of the peanut by using a routine method; carrying out image correction and background deletion of the hyperspectral images, and extracting an average spectrum; using the average spectrum after pretreatment as an independent variable, the sucrose content as a dependent variable, building a regression model of the full waveband sucrose content; based on the regression model, using a regression coefficient for determining characteristic wavelengths, and establishing and verifying the quantitative model. The method is rapid, simple, highly efficient, free of chemical reagents, and accurate in determination result. The method does not damage any sample and achieves visualization of peanut sucrose content.

Description

technical field [0001] The invention relates to a method for detecting sucrose content in peanuts, in particular to a method for detecting the distribution of sucrose content in peanuts based on hyperspectral imaging technology. Background technique [0002] Peanuts contain a variety of nutrients, such as protein, fat and carbohydrates. Among carbohydrates, sucrose is one of the most important sugars. The sweetness of raw peanuts is mainly derived from sucrose; the unique flavor of roasted peanuts is produced by the Maillard reaction between sucrose and free amino acids during peanut roasting. Therefore, the level of sucrose content in peanuts directly affects the taste quality of peanut products. Traditional methods for the determination of sucrose in peanuts include: high performance liquid chromatography and acid hydrolysis, but these methods have disadvantages such as slow analysis speed, cumbersome operation steps, high cost and strong destructiveness, and the use of r...

Claims


Application Information

Patent Timeline
Patent Type & Authority Patents(China)
IPC IPC(8): G01N21/25
Inventor 王强刘红芝于宏威石爱民刘丽胡晖瑞哈曼米兹比瑞
Owner INST OF AGRO FOOD SCI & TECH CHINESE ACADEMY OF AGRI SCI
Learn More