Method for detection of oleic acid content distribution in peanut based on hyperspectral imaging technology
A hyperspectral imaging and hyperspectral technology, applied in the measurement of color/spectral characteristics, etc., can solve the problems of detecting peanut oleic acid, and achieve the effect of increasing the difference, improving the robustness and prediction ability
- Summary
- Abstract
- Description
- Claims
- Application Information
AI Technical Summary
Problems solved by technology
Method used
Image
Examples
Embodiment 1
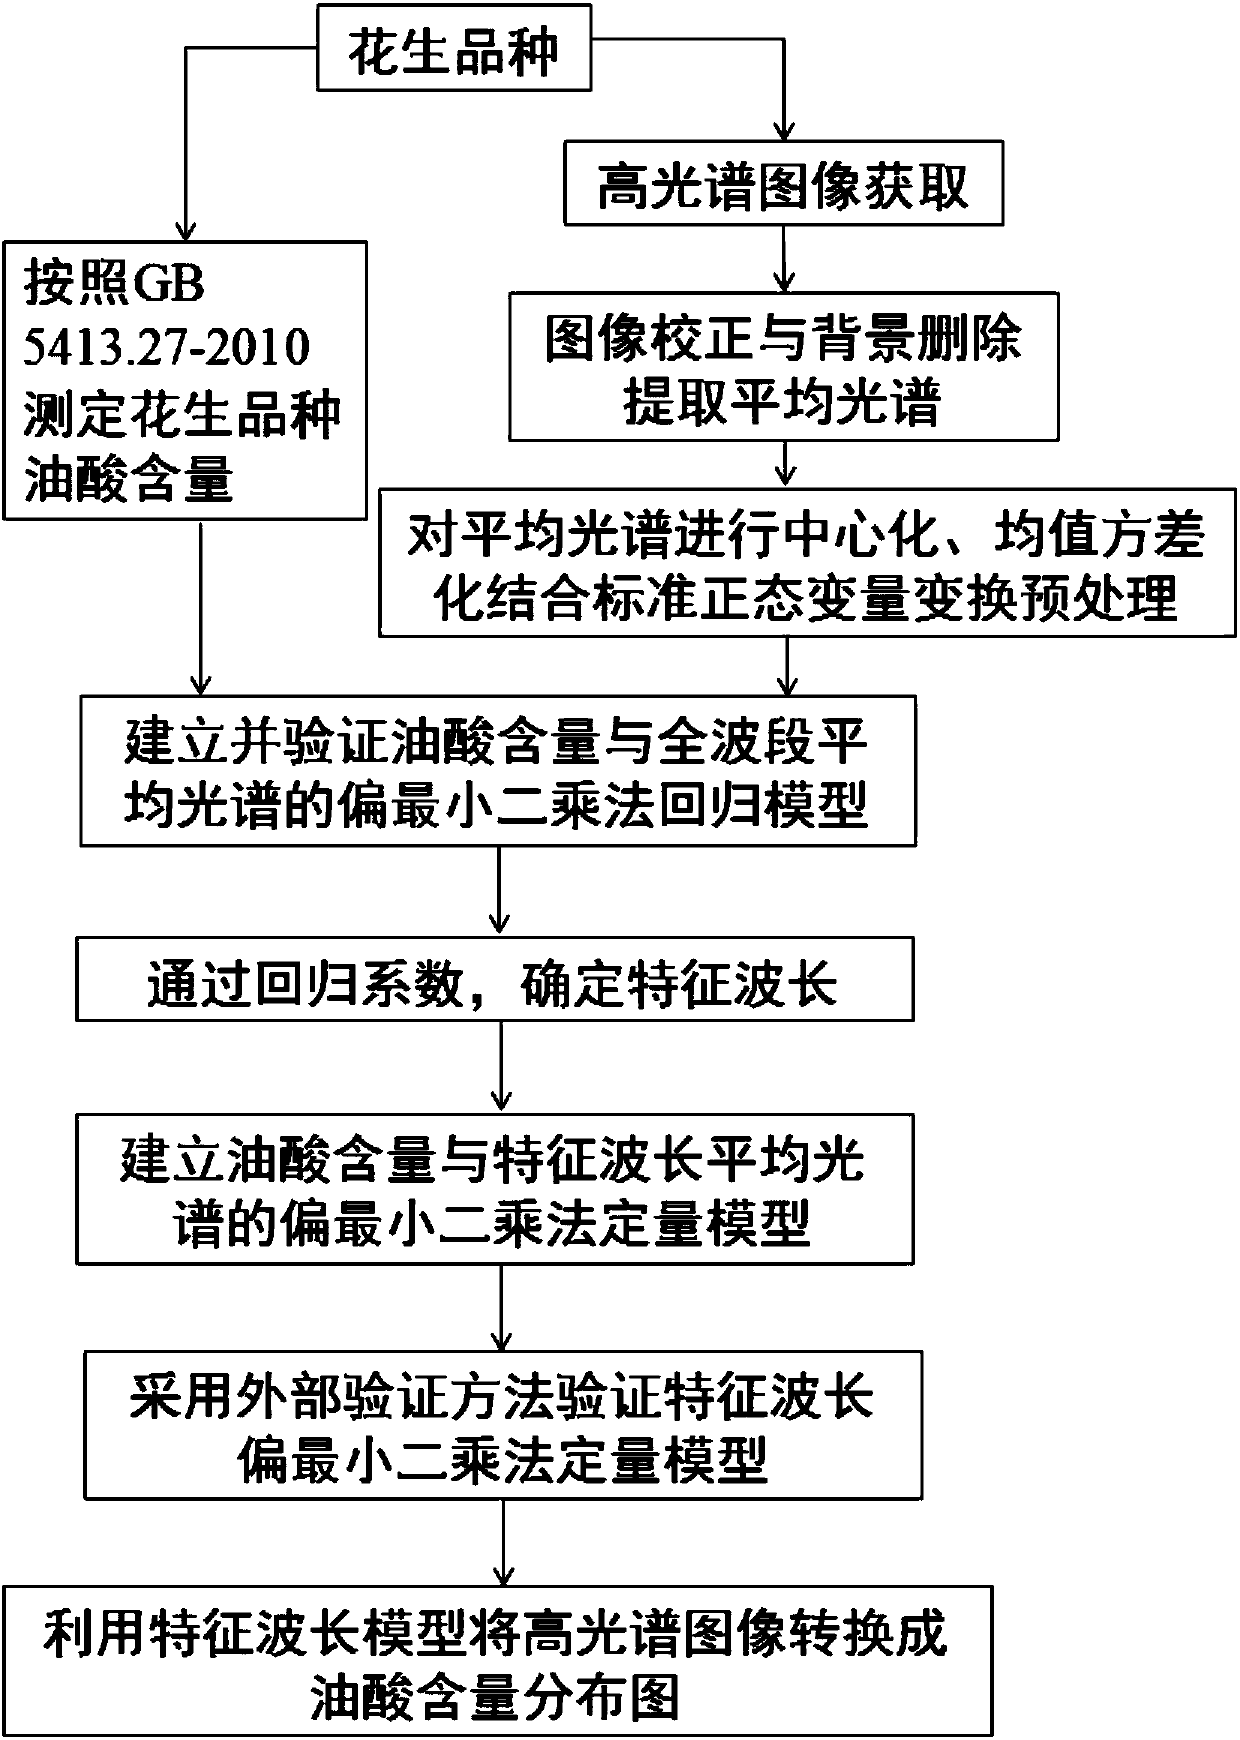
[0068] The present embodiment provides a method for establishing a quantitative model of oleic acid content distribution in peanuts based on hyperspectral imaging technology, the method comprising the following steps:
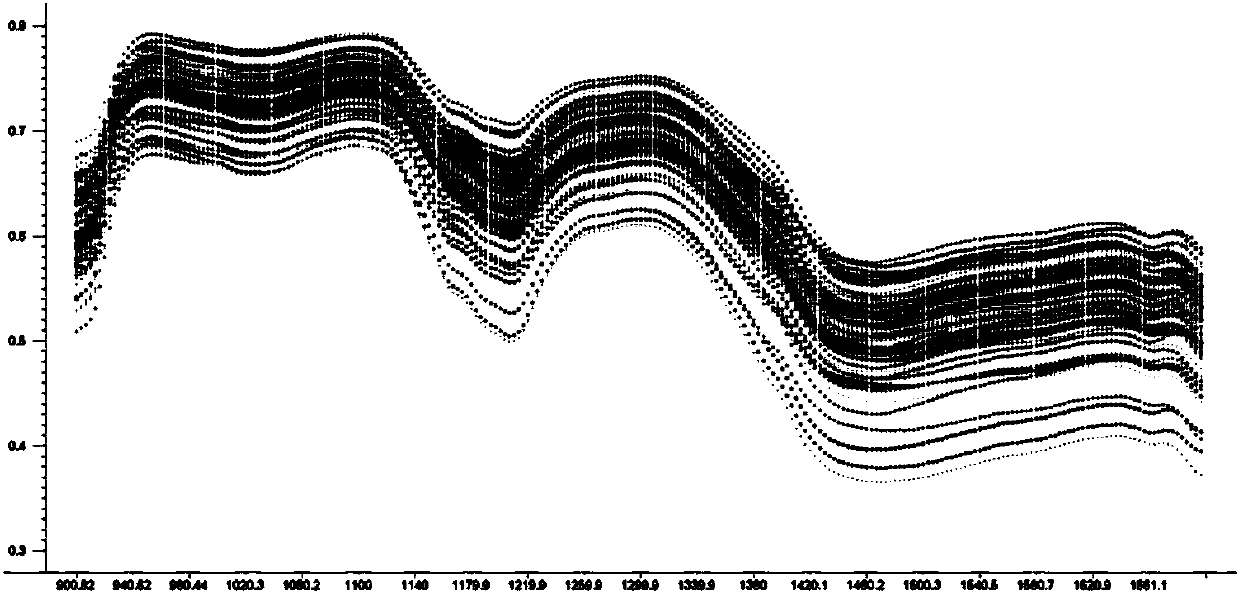
[0069] 1.1 Collect 96 varieties of peanut samples mainly planted in my country's main planting provinces in 2012, 2013 and 2014, select 30 complete peanut kernels from each variety, and use a hyperspectral instrument to simultaneously scan each pixel point in the peanut sample at each wavelength The image information of the peanut sample was repeated three times, and the average value of the three scanned hyperspectral images was taken to obtain the original hyperspectral three-dimensional image of the peanut sample. Before each scan, collect a full white calibration image I white and all-black calibration image I dark .
[0070] 1.2 After correcting and deleting the background of the original hyperspectral three-dimensional image of the above-mentioned peanut...
Embodiment 2
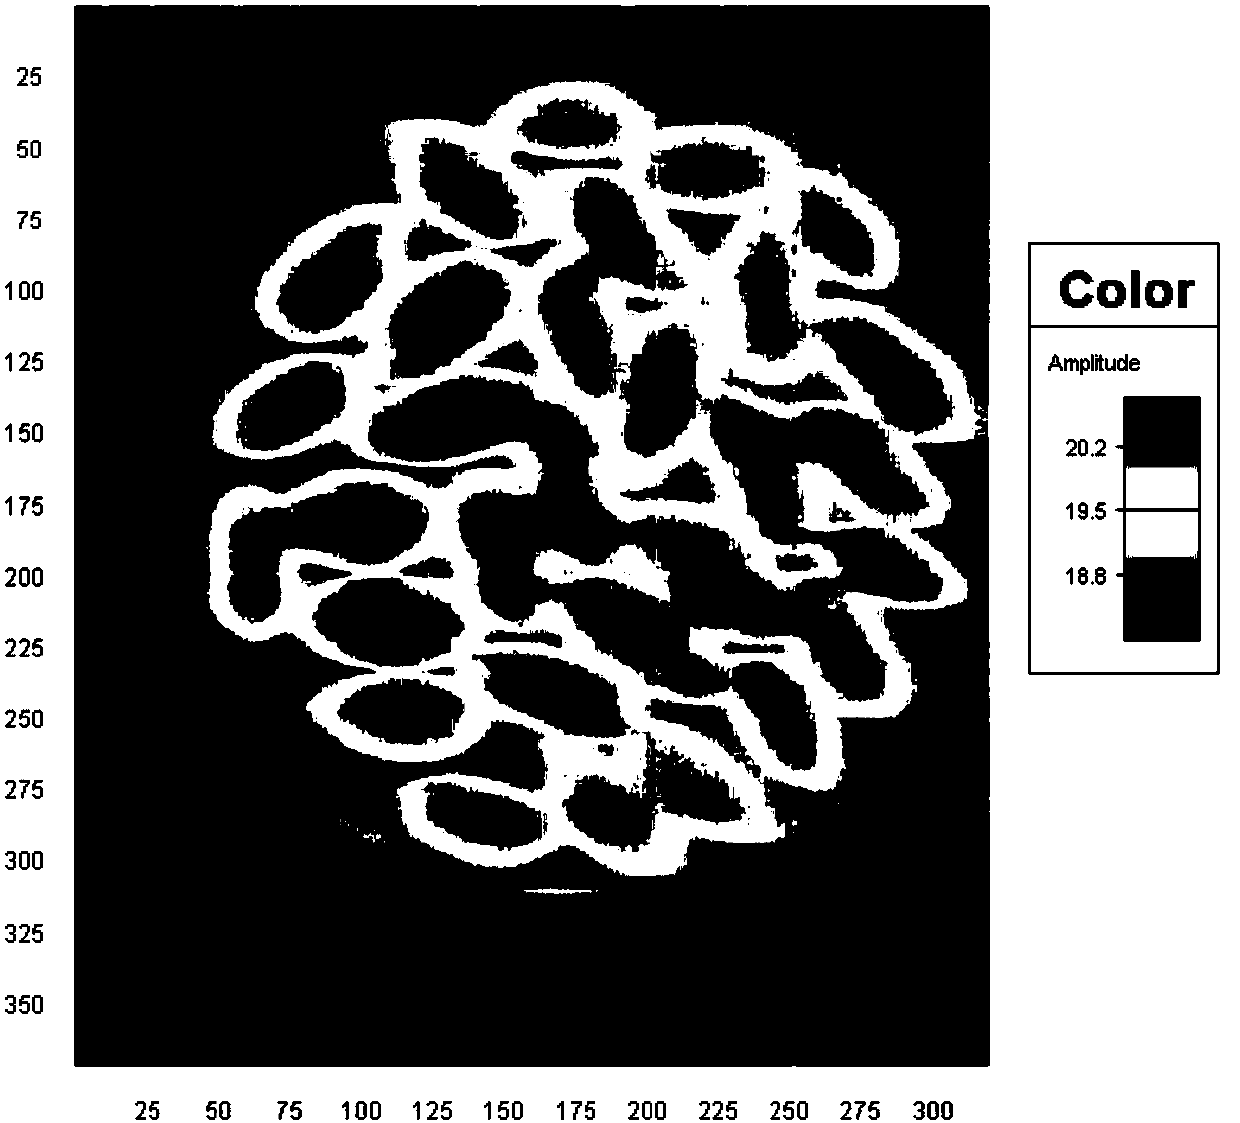
[0094] The present embodiment provides a method for detecting oleic acid content distribution in peanuts based on hyperspectral imaging technology, the method comprising the following steps:
[0095] 1) Collect the spectral images of the peanut samples to be tested at the following characteristic wavelengths: 901nm, 980nm, 1064nm, 1147nm, 1230nm, 1313nm, 1397nm, 1480nm, 1564nm, 1648nm;
[0096] Specific process: take another single peanut variety, obtain the original hyperspectral three-dimensional image of the peanut sample with a hyperspectral instrument in the same way as in Example 1; then use the same method as in Example 1 to extract the average spectrum of the peanut sample image; The average spectrum of the peanut sample image of the variety is preprocessed by centering, mean variance, and standard normal variable transformation; finally, the spectral image of the peanut sample at the above-mentioned characteristic wavelengths is obtained.
[0097] 2) Input the spectra...
PUM
| Property | Measurement | Unit |
|---|---|---|
| wavelength | aaaaa | aaaaa |
Abstract
Description
Claims
Application Information
 - R&D
- Intellectual Property
- Life Sciences
- Materials
- Tech Scout
- Unparalleled Data Quality
- Higher Quality Content
- 60% Fewer Hallucinations
Browse by: Latest US Patents, China's latest patents, Technical Efficacy Thesaurus, Application Domain, Technology Topic, Popular Technical Reports.
© 2025 PatSnap. All rights reserved.Legal|Privacy policy|Modern Slavery Act Transparency Statement|Sitemap|About US| Contact US: help@patsnap.com


