Method for detecting fat content distribution in peanuts based on hyperspectral imaging technology
A technology of hyperspectral imaging and fat content, which is applied in the direction of color/spectral characteristic measurement, etc., can solve the problems of detecting the distribution of peanut fat content, achieve the effect of improving resolution and sensitivity, and eliminating interference
- Summary
- Abstract
- Description
- Claims
- Application Information
AI Technical Summary
Problems solved by technology
Method used
Image
Examples
Embodiment 1
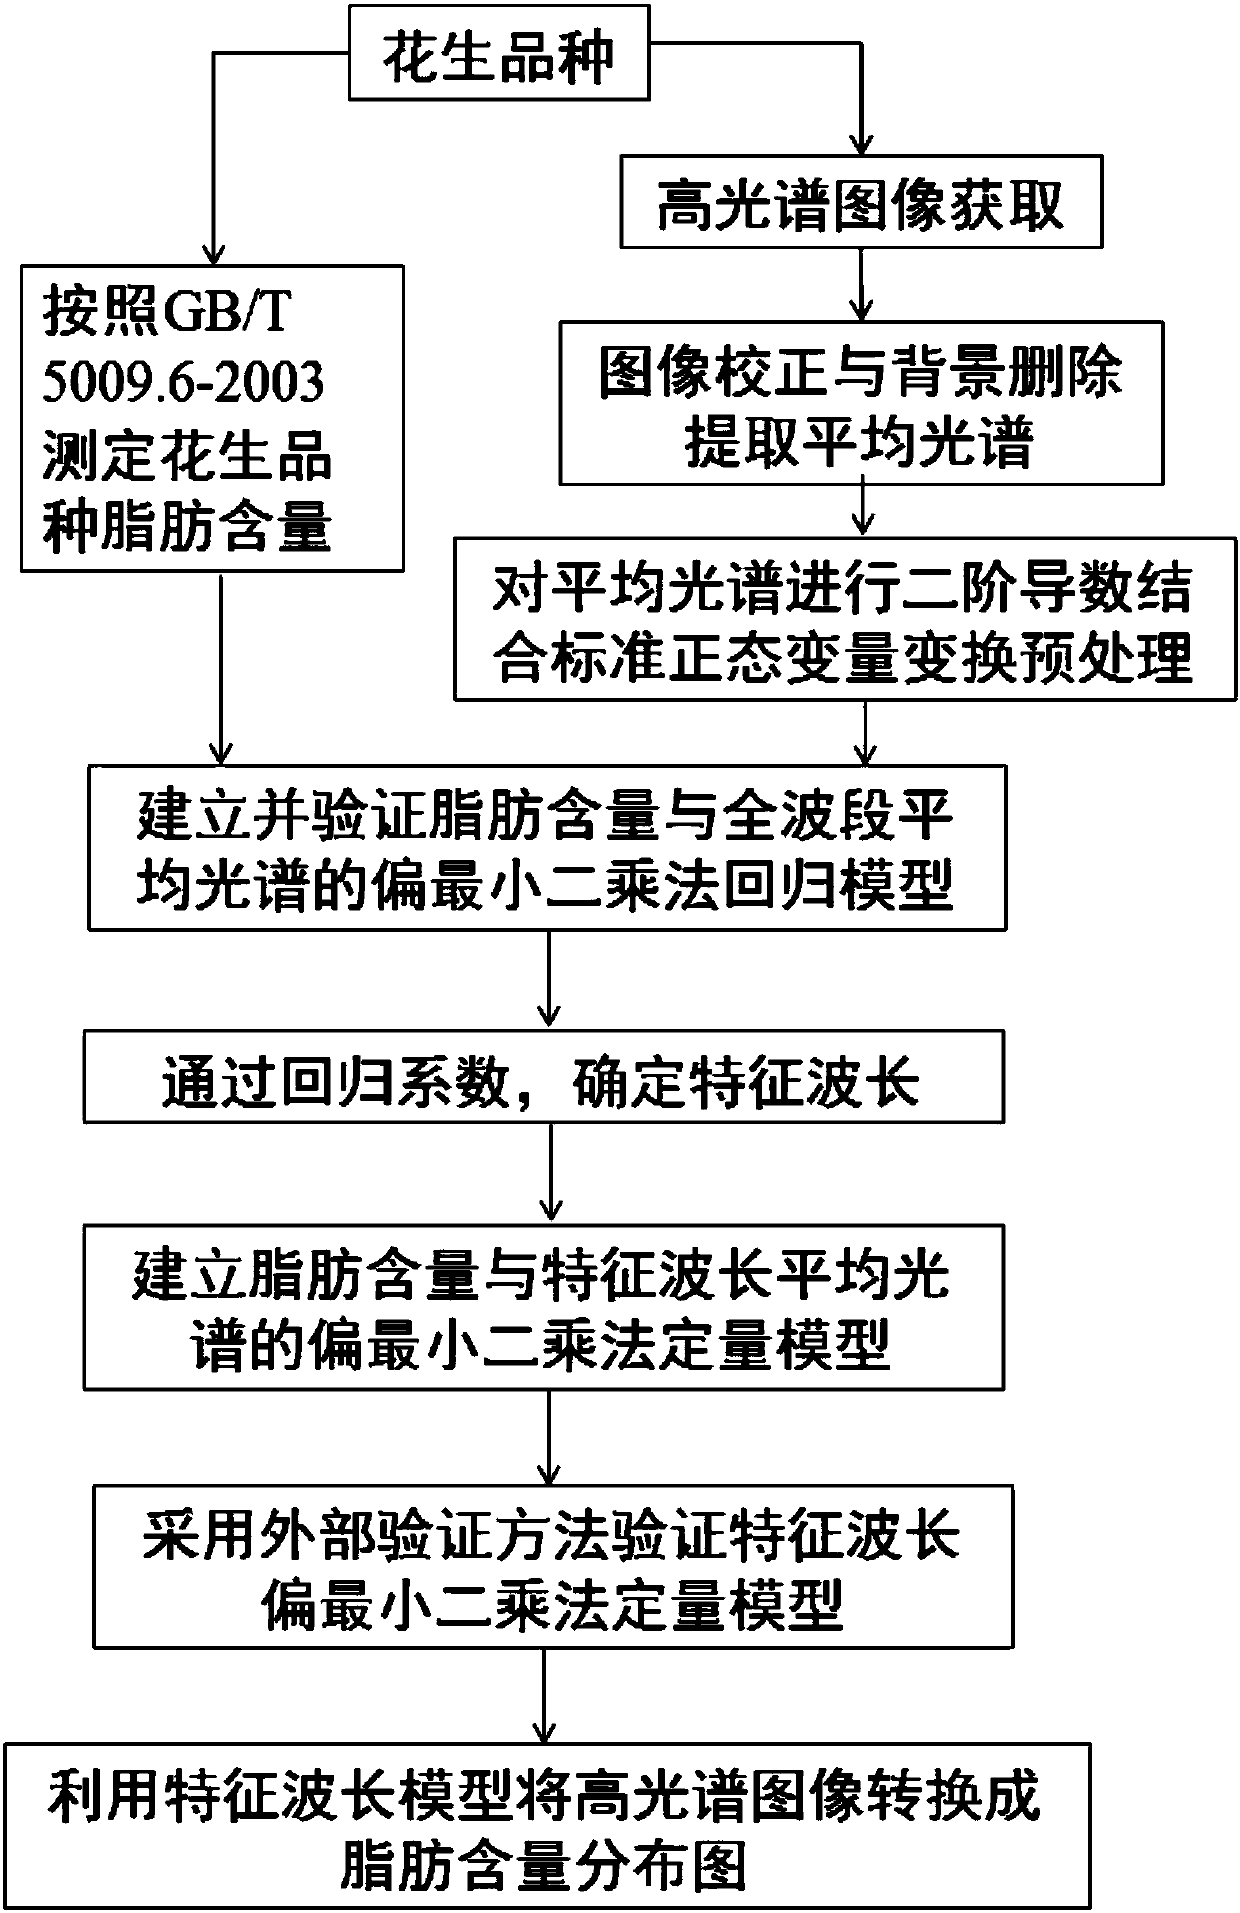
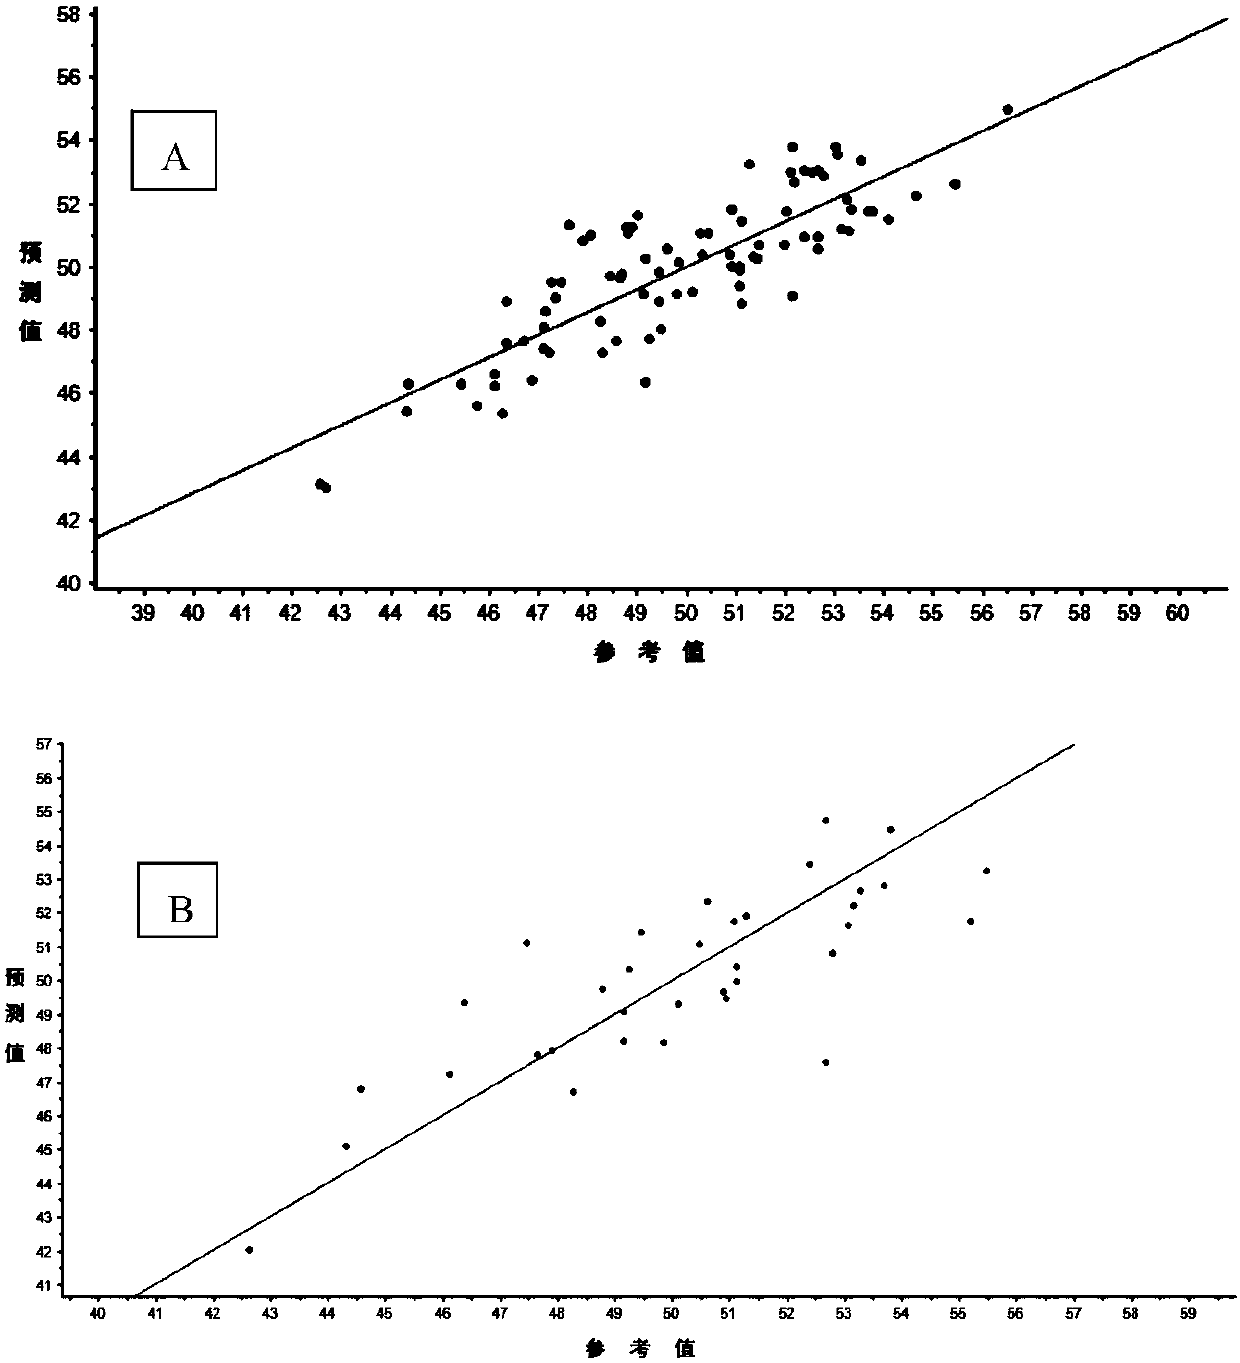
[0066] The present embodiment provides a method for establishing a quantitative model of fat content distribution in peanuts based on hyperspectral imaging technology, the method comprising the following steps:
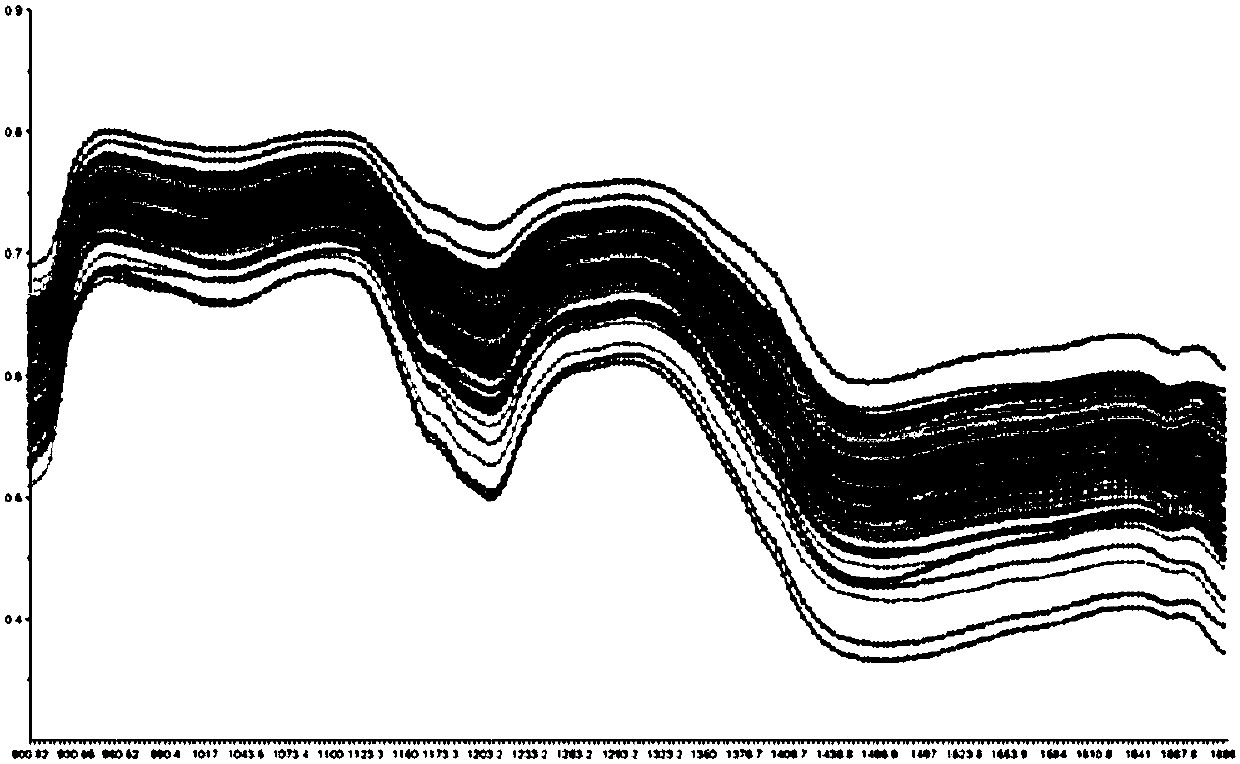
[0067] 1.1 Collect 120 varieties of peanut samples mainly planted in my country's main planting provinces in 2012, 2013 and 2014, select 30 complete peanut kernels from each variety, and use a hyperspectral instrument to simultaneously scan each pixel point in the peanut sample at each wavelength The image information, the spectral wavelength range is 900-1700nm, the scanning method is line scanning, repeated 3 times, and the average value of the hyperspectral images scanned for 3 times is taken. The original hyperspectral 3D image of the peanut sample was obtained. Before each scan, collect a full white calibration image I white and all-black calibration image I dark .
[0068] 1.2 After correcting and deleting the background of the original hyperspectral three-dim...
Embodiment 2
[0089] The present embodiment provides a method for detecting fat content distribution in peanuts based on hyperspectral imaging technology, the method comprising the following steps:
[0090] 1) Collect the spectral images of the peanut samples to be tested at the following characteristic wavelengths: 931nm, 941nm, 964nm, 1143nm, 1157nm, 1317nm, 1400nm, 1434nm, 1658nm, 1661nm, 1668nm, 1678nm;
[0091] Specific process: Take another 6 peanut varieties, use the hyperspectral instrument to obtain the original hyperspectral three-dimensional image of the peanut sample in the same way as in Example 1; then use the same method as in Example 1 to extract the average spectrum of the peanut sample image; The average spectrum of the images of the 6 peanut samples was preprocessed by the second derivative combined with the standard normal variable transformation; finally the spectral reflectance values of the 6 peanut samples at the above characteristic wavelengths were obtained.
[0...
PUM
 Abstract
Description
Claims
Application Information
 - R&D
- Intellectual Property
- Life Sciences
- Materials
- Tech Scout
- Unparalleled Data Quality
- Higher Quality Content
- 60% Fewer Hallucinations
Browse by: Latest US Patents, China's latest patents, Technical Efficacy Thesaurus, Application Domain, Technology Topic, Popular Technical Reports.
© 2025 PatSnap. All rights reserved.Legal|Privacy policy|Modern Slavery Act Transparency Statement|Sitemap|About US| Contact US: help@patsnap.com


