Abnormality detection optimization method oriented to power grid spatio-temporal data

An optimization method and technology of spatiotemporal data, applied in data processing applications, forecasting, instruments, etc., can solve problems such as only detection, high time and space costs, and users cannot customize distribution models.

Inactive Publication Date: 2016-02-24
CHINA ELECTRIC POWER RES INST +2
View PDF0 Cites 8 Cited by
  • Summary
  • Abstract
  • Description
  • Claims
  • Application Information

AI Technical Summary

Problems solved by technology

[0003] For the study of distribution network faults, the scope and duration of the fault must first be determined. The existing statistical-based anomaly detection methods have three disadvantages, so that they cannot be directly used in the current grid spatio-temporal data
1) Most statistical-based anomaly detection methods are based on purely spatial retrieval without considering the temporal dimension; 2) Most existing spatial / temporal data anomaly detection can only be used for fixed statistical models, such as the commonly used sss( spatialandspace-timescanstatistic) spatial and spatiotemporal scanning model, the disadvantage of this model is that it can only detect significantly increased regions, and users cannot customize the distribution model of data according to actual data; 3) the existing statistical-based anomaly detection methods are in When dealing with high-dimensional large-scale data sets, the time and space costs of the program are still high, and the efficiency is low. Therefore, it is necessary to provide a general-purpose anomaly detection method based on statistical models that can handle massive spatio-temporal data.

Method used


Image

  • Abnormality detection optimization method oriented to power grid spatio-temporal data
  • Abnormality detection optimization method oriented to power grid spatio-temporal data
  • Abnormality detection optimization method oriented to power grid spatio-temporal data

Examples


Embodiment Construction

[0098] The present invention will be further described in detail below in conjunction with the accompanying drawings.

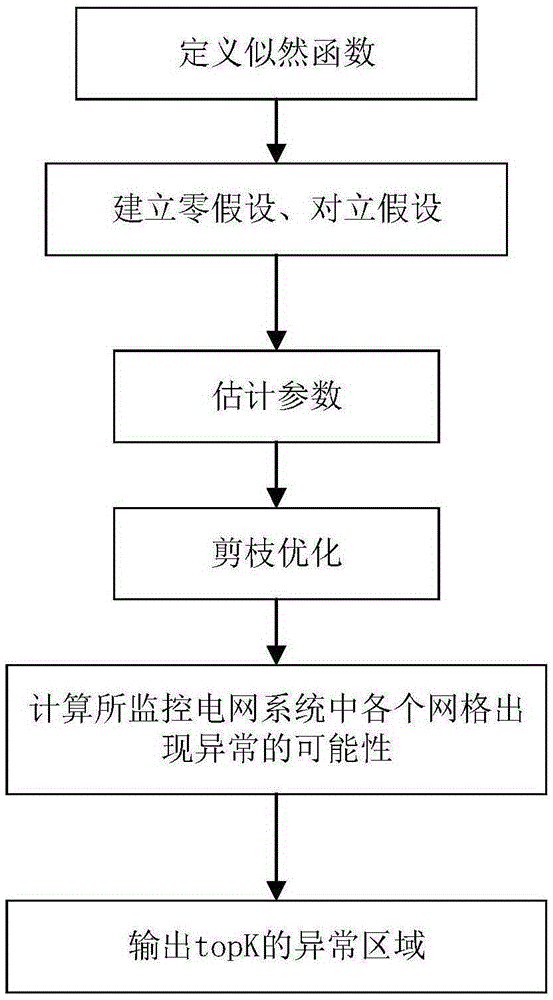
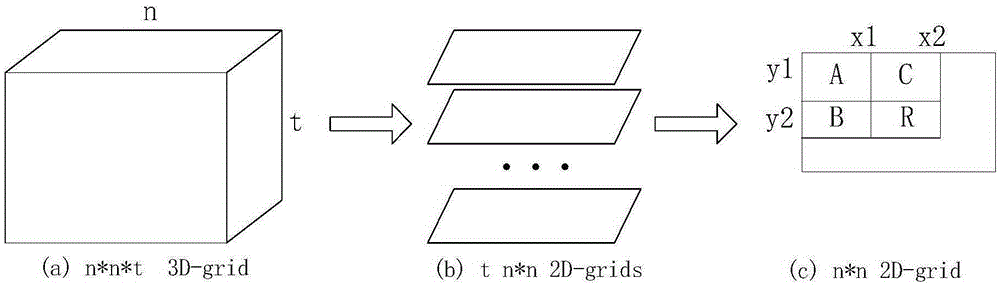
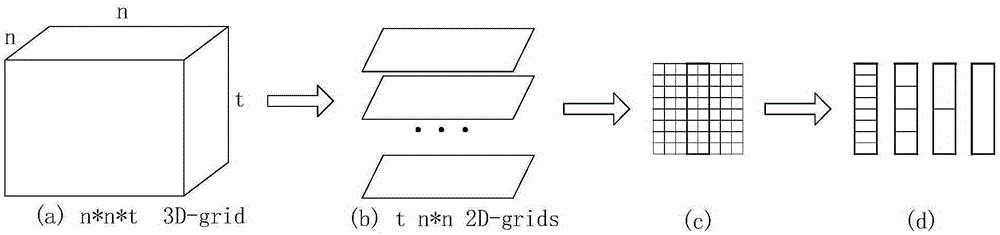
[0099] The invention proposes a likelihood ratio test anomaly detection method for collecting time and space (two-dimensional position) three-dimensional spatio-temporal data for massive power grid equipment in smart grid management to collect time series data streams: 3D-LRT (ananomaly detection method based on likelihood ratio test for three-dimensional spatio -temporaldata), and use the pruning method to optimize it, the massive data generated in the operation of the distribution network (including the data collected by the distribution network automation terminal, the distribution network power load data, the distribution network power marketing data, etc. ) to classify, find out the abnormal data, and score the abnormal level. The core part of the present invention is the proposal of the 3D-LRT method and its optimization method.

[0100] like figure 1...


PUM


Abstract

The present invention provides an abnormality detection optimization method oriented to power grid spatio-temporal data. The method comprises the following steps: (1) performing mesh division on a power distribution device according to spatial positions, then carrying out uniform division on power distribution power curves of acquisition devices in all meshes according to time, and defining a Gaussian distribution for power-distribution average power in each division; (2) establishing a null hypothesis and an alternative hypothesis; (3) estimating parameters, i.e. estimating values of testing parameters TP in the null hypothesis and the alternative hypothesis according to a maximum likelihood estimation method; (4) carrying out pruning optimization; (5) calculating a likelihood ratio of three-dimensional spacial data, wherein the higher the ratio is, the more obvious the abnormality of an area is; and (6) outputting first K abnormal areas by adopting a heap sort algorithm, and according to chi square distribution and in combination with a confidence level, acquiring an abnormality threshold. According to the abnormality detection optimization method provided by the present invention, power distribution network monitored data is classified so as to improve a fault detection technology aiming at a power distribution network and efficiently process interference of outside factors to power scheduling.

Description

technical field [0001] The invention relates to a detection and optimization method, in particular to an abnormality detection and optimization method for grid spatiotemporal data. Background technique [0002] With the transformation of the power system to the smart grid, the informatization process of the distribution network is accelerating, and the power system has a huge monitoring data set. It plays an important role in decision support and planning. Due to the complexity of the software and hardware architecture of the monitoring equipment, the interference of external determinations or uncertain factors, the monitoring data is often abnormal. Therefore, it is necessary to improve the level of fault detection technology for the distribution network, so as to reasonably arrange the power supply and efficiently deal with the interference of external factors on the power dispatching. [0003] For the research of distribution network faults, the first step is to determi...

Claims


Application Information

Patent Timeline
Patent Type & Authority Applications(China)
IPC IPC(8): G06Q10/04G06Q50/06
CPCG06Q10/04G06Q50/06Y02E40/70Y04S10/50
Inventor 刘科研刁赢龙孟晓丽盛万兴贾东梨胡丽娟何开元叶学顺蔡春丽张孝
Owner CHINA ELECTRIC POWER RES INST
Why Eureka
Try Eureka