Regression analysis-based news competitiveness analysis method and visualization device
A technology of regression analysis and analysis method, applied in other database retrieval, special data processing applications, instruments, etc., can solve the problem of single mode and achieve a high degree of fitting effect
- Summary
- Abstract
- Description
- Claims
- Application Information
AI Technical Summary
Problems solved by technology
Method used
Image
Examples
Embodiment 1
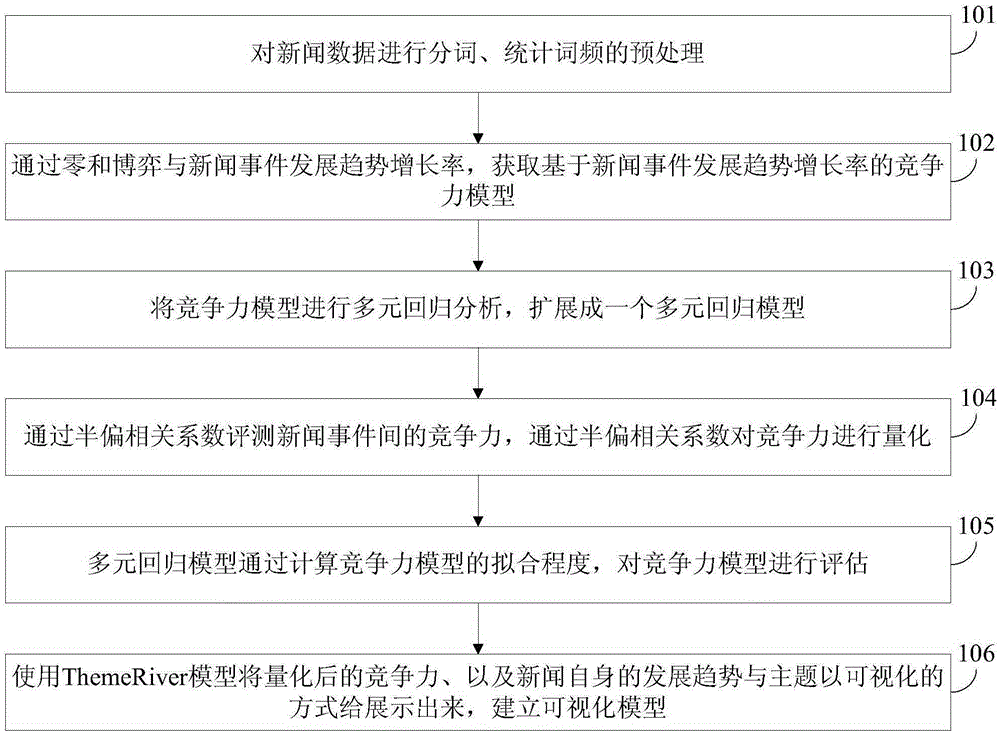
[0042] A method of news competitiveness analysis based on regression analysis, see figure 1 , This method displays the competitive relationship through a visual model. The news competitiveness analysis method includes the following steps:
[0043] 101: Preprocessing of word segmentation and word frequency statistics on news data;
[0044] The embodiment of the present invention utilizes the existing word segmentation tool to perform Chinese word segmentation processing on news data released by news media, and counts the release amount and release time of the news data, and counts the word frequency through the word segmentation results. The specific operation of this step is not described in detail in the embodiment of the present invention.
[0045] 102: Through the zero-sum game and the growth rate of the development trend of news events, obtain a competitiveness model based on the growth rate of the development trend of news events;
[0046] For news events, the media's disseminat...
Embodiment 2
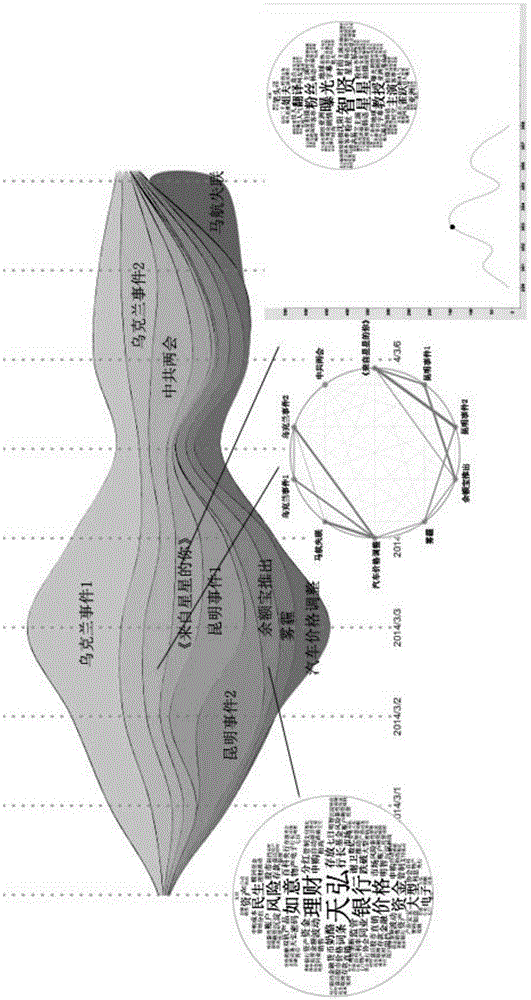
[0062] The following combines specific calculation formulas, examples and Attached drawing Describe the scheme in Example 1 in detail, and visualize the overall display effect of the model Such as figure 1 As shown, the embodiment of the present invention is mainly divided into two major steps, one is the theoretical derivation and evaluation of the competitiveness model, and the other is to perform visual analysis by establishing a visual model, as detailed in the following description:
[0063] 201: Preprocessing of word segmentation and word frequency statistics on news data;
[0064] The embodiment of the present invention uses the existing word segmentation tool to perform word segmentation and statistical word frequency preprocessing on the original data on the news media, and provides a data basis for subsequent model evaluation and visualization analysis. For specific operation steps, refer to Embodiment 1, which is not described in detail in this embodiment of the presen...
Embodiment 3
[0100] The feasibility verification of the schemes in Example 1 and Example 2 will be carried out in conjunction with specific experiments, as detailed in the following description:
[0101] The embodiment of the present invention is mainly aimed at the evaluation and analysis of the news event competitiveness model, and the validity of the news event competitiveness model can be determined through the evaluation and analysis to determine whether the model is applicable.
[0102] Evaluation results of the present invention As shown in Table 1 with Table 2 Shown.
[0103] Table 1 Experimental evaluation results
[0104]
[0105] Table 2 Experimental evaluation results
[0106]
[0107] Evaluation results As shown in Table 1 with Table 2 Shown. In the above table, y represents the actual report increment of the news event, Represents the increase in news reports estimated using the competitiveness model, R 2 Represents the complete square deviation of estimated value and actual v...
PUM
 Abstract
Description
Claims
Application Information
 - R&D
- Intellectual Property
- Life Sciences
- Materials
- Tech Scout
- Unparalleled Data Quality
- Higher Quality Content
- 60% Fewer Hallucinations
Browse by: Latest US Patents, China's latest patents, Technical Efficacy Thesaurus, Application Domain, Technology Topic, Popular Technical Reports.
© 2025 PatSnap. All rights reserved.Legal|Privacy policy|Modern Slavery Act Transparency Statement|Sitemap|About US| Contact US: help@patsnap.com


