[0060] The present invention will be further described in detail below in conjunction with the drawings.
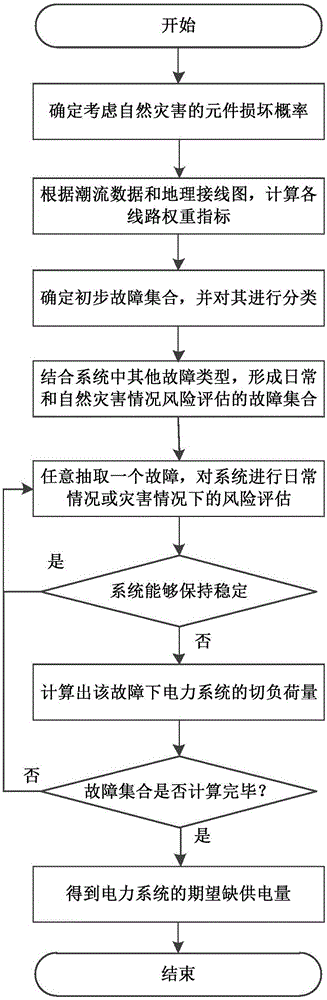
[0061] The present invention provides a power system transient risk assessment method considering natural disasters, (such as figure 1 ) The method includes the following steps:
[0062] Step 1: Determine the probability of component damage considering natural disasters;
[0063] Step 2: Determine the preliminary fault set and classify it;
[0064] Step 3: Conduct transient risk assessment of the power system.
[0065] The step 1 specifically includes the following steps:
[0066] Step 1-1: Divide natural disasters into Type I natural disasters and Type II natural disasters;
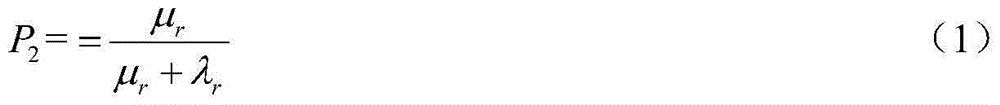
[0067] Step 1-2: Determine the probability of component damage considering Type I natural disasters and Type II natural disasters respectively.
[0068] In the step 1-1, Type I natural disasters include typhoons, icing and earthquakes;
[0069] Type II natural disasters include heavy rain, thunder and lightning and wildfires;
[0070] The probability of occurrence of Type I natural disasters is less than that of Type II natural disasters, and the impact of Type I natural disasters on the power system is greater than the impact of Type II natural disasters on the power system.
[0071] The steps 1-2 include the following steps:
[0072] Step 1-2-1: Determine the probability of component damage considering Type I natural disasters by analyzing the risk of Type I natural disasters;
[0073] Step 1-2-2: Determine the probability of component damage considering Category II natural disasters, including:
[0074] The status of the component includes normal status, rainstorm status, thunder and lightning status and wildfire status. The intact probability of components under rainstorm status, thunderstorm status and wildfire status is respectively P 2 , P 3 And P 4 Means, and has:
[0075] P 2 = = μ r μ r + λ r - - - ( 1 )
[0076] P 3 = μ f μ f + λ f - - - ( 2 )
[0077] P 4 = μ l μ l + λ l - - - ( 3 )
[0078] Where λ r And μ r Is the failure rate and repair rate of the component from the normal state to the heavy rain state, λ l And μ l Is the failure rate and repair rate of the component from the normal state to the lightning state, λ f And μ f The failure rate and repair rate of components from normal state to wildfire state;
[0079] The probability of component damage considering category II natural disasters is denoted by U, which includes:
[0080] U = 1 - P 2 × P 3 × P 4 = A + C A + B + C - - - ( 4 )
[0081] Among them, the intermediate quantity A=λ f μ r μ l +μ f λ r μ l +μ f μ r λ l , The middle quantity B=μ f μ r μ l , The intermediate quantity C=λ f μ r λ l +μ f λ r λ l +λ f μ r λ l +λ f λ r λ l.
[0082] The step 2 specifically includes the following steps:
[0083] Step 2-1: Read in the power flow data and geographic wiring diagram of the power system;
[0084] Step 2-2: Select the voltage level and line range, combine the required order of faults to form a preliminary fault set;
[0085] Step 2-3: Choose fault i from the preliminary fault set, disconnect the line in fault i, and the weight index PI of fault i i Expressed as:
[0086] PI i = X j = 1 L w s j ( S j S j max ) 2 m j - - - ( 5 )
[0087] Where w sj Indicates the weighting factor of line j, S j Represents the apparent power of line j, Indicates the apparent power limit value of line j, m j Represents the integer index of line j, j = 1, 2, ..., L, L represents the total number of lines;
[0088] Risk indicator RI of failure i i Expressed as:
[0089] RI i = X j = 1 L P ( X i ) · w s j ( S j S j max ) 2 m j - - - ( 6 )
[0090] Where P(X i ) Represents the probability of occurrence of fault i;
[0091] Step 2-4: Calculate the weight indicators and risk indicators of all failures in the preliminary failure set;
[0092] Step 2-5: Divide the preliminary fault set into a fixed fault set and a variable fault set;
[0093] The set of fixed faults includes three-phase permanent faults on single-circuit lines, three-permanent faults on parallel double-circuit lines on the same pole, busbar faults, DC transmission line single-pole faults, DC transmission line bipolar faults and transformer faults;
[0094] Sort the risk indicators of the faults in the variable fault set in descending order, and classify the faults according to the similarity and relevance.
[0095] In the step 3, the smaller the instability probability of the power system, the smaller the risk of power system instability; the instability probability of the power system is represented by P s Indicates that there are:
[0096] P s = P d I × P d I S ( X ) + P N d × P N d S ( X ) - - - ( 7 )
[0097] Where P Nd Represents the probability of occurrence of the power system under daily operating conditions, P dI Indicates the probability of occurrence of the power system in the case of Type II natural disasters, Represents the state probability of the power system in daily operation, Indicates the state probability of the power system in the case of Type II natural disasters, and has:
[0098] P N d S ( X ) = X m = 1 M Π k = 1 K P ( X k m ) X F m - - - ( 8 )
[0099] P d I S ( X ) = X n = 1 N Π k = 1 K P ( X k n ) X F n - - - ( 9 )
[0100] Among them, M is the total number of failures in daily operation, m=1, 2,...,M; N is the total number of failures in Type II natural disasters, n=1,2,...,N; F m Represents the power system test function corresponding to the mth fault in daily operation. When the power system is unstable, F m =1, when the power system is stable, F m =0; F n Represents the power system test function corresponding to the nth fault in the case of category II natural disasters, when the power system is unstable, F n =1, when the power system is stable, F n =0; P(X km ) Is the probability of component k under the mth fault in daily operation, P(X kn ) Is the probability of component k under the nth failure in the case of category II natural disasters, and has:
[0101]
[0102]
[0103] Among them, μ km And λ km Respectively represent the repair rate and failure rate of component k under the mth failure in daily operation, μ kn And λ kn Respectively represent the repair rate and failure rate of component k under the nth failure in the case of category II natural disasters;
[0104] The smaller the expected power shortage of the power system, the smaller the risk of power system load loss; the expected power shortage of the power system is expressed by EENS, which includes:
[0105] E E N S = EENS D + EENS N D = P d I X X n = 1 N Π k = 1 K P ( X k n ) X C ( X n ) X T n + P N d X X m = 1 M Π k = 1 K P ( X k m ) X C ( X m ) X T m - - - ( 12 )
[0106] Among them, EENS D Indicates the expected lack of power supply of the power system in the case of category II natural disasters, EENS ND Represents the expected lack of power supply of the power system under daily operating conditions; C(X m ) Is the load shedding of the power system corresponding to the mth fault in daily operation, T m Is the duration of the power system state corresponding to the mth fault in daily operation; C(X n ) Is the load shedding amount of the power system corresponding to the nth fault in the case of category II natural disasters, T n It is the duration of the power system state corresponding to the nth fault in the case of category II natural disasters.
[0107] As of the end of 2014, Sichuan Power Grid had 44 500 kV substations, 207 220 and 110 kV substations, and 740 respectively. The province has 2423 transmission lines of 110 kV and above, with a transmission length of 55,791 kilometers. Its geographical structure is like figure 2 Shown.
[0108] The number of second-order random faults in Sichuan Power Grid is 6109, and the number of third-order random faults is 222365. Taking the second-order fault as an example, the PI value of each fault is calculated. All second-order faults can be divided into 6 sets. In order to measure whether the PI value check and the classification of the fault set are reasonable, the PSD-BPA program is used to calculate the safety of the system under the three-phase short circuit fault of the line shown in the set 1-6, the PI value of the second-order fault and the safety check result. As shown in Table 1:
[0109] Table 1
[0110]
[0111] It can be seen from Table 1 that the PI value of each level of failure can be found in a range, and the consequences of the failure in this range are similar to the system; most of the failure PIs belong to this range, and a small part of the failures belong to the system. The resulting faults are more serious, and this part of the fault happens to be the serious fault to be looked for.
[0112] Due to the lack of statistical laws of electrical equipment for Type II natural disasters, in order to prove the method proposed in this article, more research on Type I natural disaster data will be used for the time being instead. Sichuan is the hardest hit by the earthquake, so the probability of occurrence of earthquake disaster is estimated according to the probability of exceeding 10% in 50 years, and the probability of occurrence of line ice disaster is estimated according to the one in 30 years. According to the seismic intensity map, it is estimated that the PGA of the Shimian substation is 0.2, the PGA of the Danjing, Ya'an, and Jiulong substations are 0.15, and the PGA of the other substations are all no more than 0.1. According to the rainfall of 20mm, the estimated line failure is estimated Probability. Due to space limitations, the faults with a higher probability of failure are screened out as shown in Table 2.
[0113] Table 2
[0114]
[0115] It can be seen from Table 2 that considering a single risk alone will underestimate the damage probability of the component, thereby underestimating the risk that the system may face. The comprehensive damage probability model is adopted, and the result is relatively accurate.
[0116] When calculating random failures to fourth-order failures, combined with the BPA-PSD stability calculation program, the daily operation and disaster risk assessment of the system are carried out; after the earthquake occurs, the repair time is 20 days, and the system damage probability is calculated. The assessment results are as follows Table 3 shows:
[0117] table 3
[0118]
[0119]
[0120] It can be seen from the table that the failure probability of the comprehensive scenario that considers disasters proposed in this paper is close to one order of magnitude larger than the scenario that normally only considers N-2 failures. If subsequent failures are not considered, the risk of the system will be underestimated; when based on the seismic zoning map When a fortification standard earthquake occurs, although the probability of system failure is small, once it occurs, its loss of load is very large, so it is necessary to consider the impact of natural disasters in the planning scheme.
[0121] Finally, it should be noted that the above embodiments are only used to illustrate the technical solutions of the present invention and not to limit them. Those of ordinary skill in the art can still modify or equivalently replace the specific embodiments of the present invention with reference to the above embodiments. Any modification or equivalent replacement that deviates from the spirit and scope of the present invention shall fall within the protection scope of the claims of the present invention pending approval.