Data visualization method and data visualization system based on hierarchical model

A hierarchical and data technology, applied in the field of data visualization, can solve the problem that the big picture cannot be displayed clearly

Active Publication Date: 2016-08-31
SOUTH CHINA UNIV OF TECH
View PDF4 Cites 16 Cited by
  • Summary
  • Abstract
  • Description
  • Claims
  • Application Information

AI Technical Summary

Problems solved by technology

[0010] The primary purpose of the present invention is to overcome the shortcomings and deficiencies of the prior art, and provide a data visualization method based on a hierarchical model, which greatly improves the layout effect of the algorithm by adopting a hierarchic

Method used


Image

  • Data visualization method and data visualization system based on hierarchical model
  • Data visualization method and data visualization system based on hierarchical model
  • Data visualization method and data visualization system based on hierarchical model

Examples


Embodiment

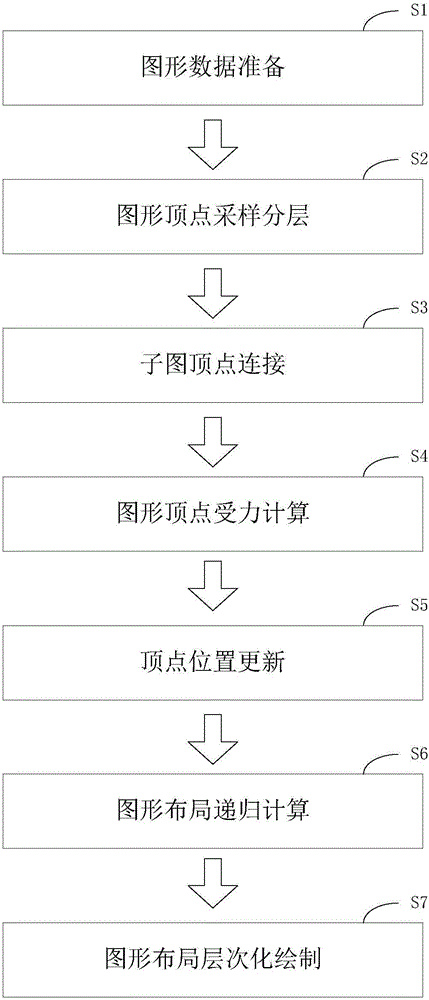
[0162] Such as figure 1 As shown, an overall flowchart of a data visualization method based on a hierarchical model, the data visualization method based on a hierarchical model includes the following steps:

[0163] S1. Graphic data preparation: assign a specific ID number to each vertex and each undirected edge, and generate a structured graphic data file according to a certain format.

[0164] S2. Layered graph vertex sampling: Recursive sampling is performed on the vertex sets of the original graph to generate multiple vertex sets with gradually decreasing number of vertices.

[0165] S3. Subgraph vertex connection: According to the geometric structure characteristics of the original graph, the breadth-first search method is used to connect the adjacent vertices, generate the edge set of the subgraph, and obtain the complete subgraph data.

[0166] S4. Calculate the force on the vertex of the graph: randomly initialize the position of each vertex in the original graph, app...


PUM


Abstract

The invention discloses a data visualization method and a data visualization system based on a hierarchical model. The data visualization method comprises the following steps: graph data preparation, graph vertex sampling stratification, sub-graph vertex connection, graph vertex stress calculation, vertex position updating, graph layout recursive calculation, and graph layout hierarchical drawing. The data visualization system comprises a graph data preparation module, a graph vertex sampling stratification module, a sub-graph vertex connection module, a graph vertex stress calculation module, a vertex position updating module, a graph layout recursive calculation module, and a graph layout hierarchical drawing module. Algorithm convergence can be accelerated, the layout can be calculated correctly, and the effect stability is kept. In addition, graph layout of big data can be drawn scientifically, and convenient interactive operation is provided. Therefore, the data visualization method and the data visualization system have the advantage that beautiful layout can be calculated quickly and efficiently and users can be helped to mine the potential knowledge laws.

Description

technical field [0001] The invention relates to a data visualization technology, in particular to a hierarchical model-based data visualization method and system thereof. Background technique [0002] At present, with the rapid development of the information age, information technologies such as e-commerce, social networks, mobile Internet, and digital homes have been widely used in people's work and life. These applications continue to generate massive amounts of data, and these data contain various potentially valuable information. The analysis and management of big data will create huge economic effects and social value. For example, in the commercial field, big data will help companies grasp market dynamics, specify precise marketing strategies, and provide consumers with more timely and personalized services. In the field of public utilities, big data helps maintain social stability and promote economic development; in the medical field, big data helps track and deal w...

Claims


Application Information

Patent Timeline
IPC IPC(8): G06F17/30
CPCG06F16/26
Inventor 蔡毅陈震鸿闵华清
Owner SOUTH CHINA UNIV OF TECH
Why Eureka
Try Eureka