System and method for interactive visual analytics of multi-dimensional temporal data

A technology of multi-dimensional data and analysis methods, applied in visual data mining, data processing applications, image data processing, etc., can solve the problems of not transmitting large and complex data sets, insights and trends, and unintuitive visualization.

Active Publication Date: 2016-10-26
STATE STREET CORPORATION
View PDF4 Cites 15 Cited by
  • Summary
  • Abstract
  • Description
  • Claims
  • Application Information

AI Technical Summary

Problems solved by technology

These traditional methods for temporal representation include, for example, rectangular geometric structures or heat maps; however, these visualizations are not intuitive and do not properly convey the temporal elements of the data for system users to gain insight and trend

Method used


Image

  • System and method for interactive visual analytics of multi-dimensional temporal data
  • System and method for interactive visual analytics of multi-dimensional temporal data
  • System and method for interactive visual analytics of multi-dimensional temporal data

Examples


Embodiment Construction

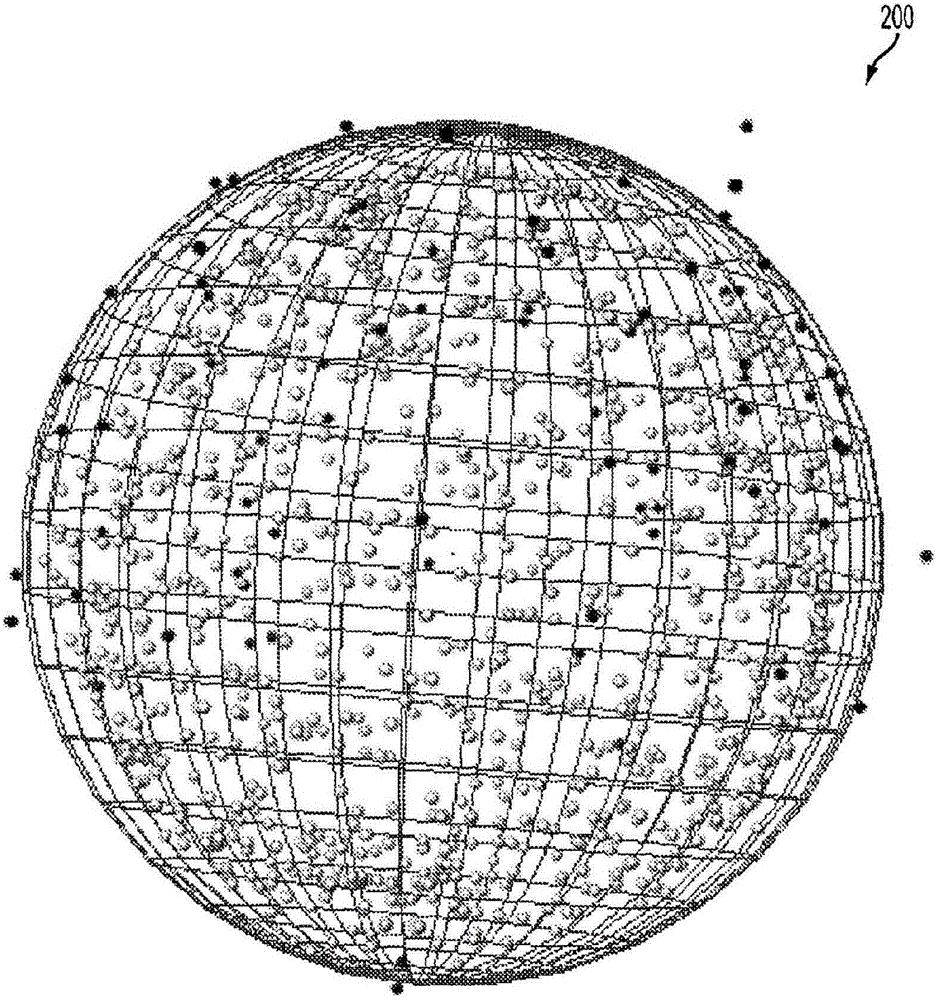
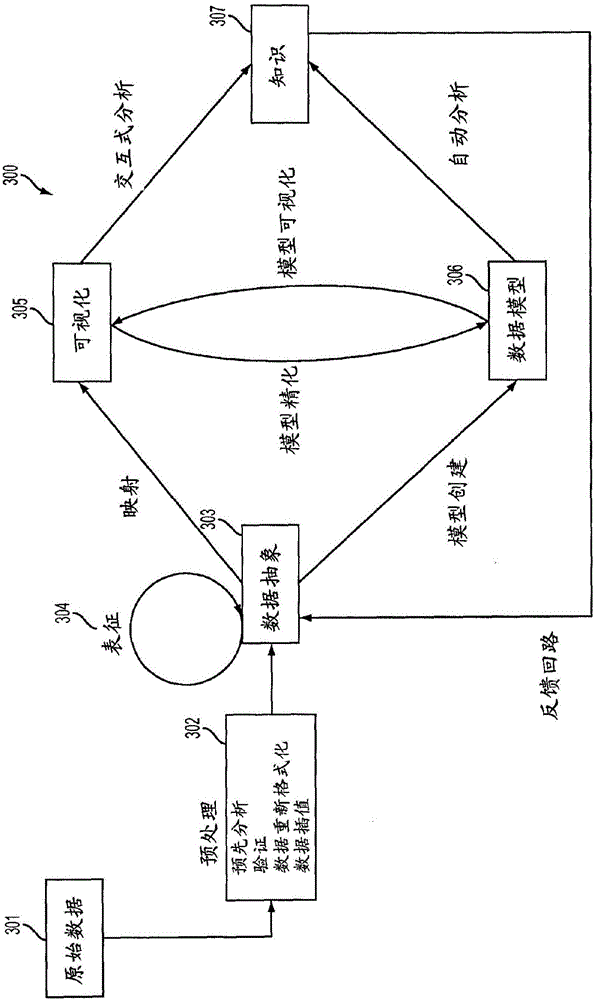
[0046] The present invention relates to a visual analysis system and method for providing interactive analysis of multidimensional temporal data. The disclosed systems and methods utilize novel 3D visualizations that allow for a concise global overview of large-scale data, with the ability to drill down into the data for further details. The system extends the capabilities of existing mapping techniques by visualizing domain data based on 3D geometric structures augmented with size, color, motion and sound. The system is designed with customizable visualizations that can be adapted to different data models and applied to multiple domains. The system adapts to different data models by visualizing the data using a virtual universe and a set of spheres, defining the data model with longitude, latitude, and distance from the center of the spheres. Different perspective views and provided filters may be adapted to provide visualization of different data models.

[0047] The visua...


PUM


Abstract

Multi-dimensional temporal data can provide insight into patterns, trends and correlations. Traditional 2D-charts are widely used to support domain analysts' work, but are limited to present large-scale complicated data intuitively and do not allow further exploration to gain insight. A visual analytics system and method which supports interactive analysis of multi- dimensional temporal data, incorporating the idea of a novel visualization method is provided. The system extends the ability of mapping techniques by visualizing domain data based on a 3D geometry enhanced by color, motion and sound. It allows a compact universal overview of large-scale data and drilling down for further exploration. By customizable visualization, it can be adapted to different data models and applied to multiple domains. It helps analysts interact directly with large-scale data, gain insight into the data, and make better decisions.

Description

technical field [0001] The present invention relates to computer-based systems and methods for interactive analysis of multidimensional temporal data, and more particularly, to computer-based systems and methods for three-dimensional visualization of large-scale data. Background technique [0002] Multidimensional temporal data is very common in many fields of business and science. Today, large-scale data is growing at an explosive rate everywhere. While the ability to collect and store new data is growing rapidly, the ability to analyze this volume of data is growing at a much lower rate. While it is not easy to analyze large and complex data, it is useful to gain insights into patterns, trends and correlations. This means that there is greater potential value in large-scale complex data. [0003] In the past, researchers have proposed many automated analysis methods (such as principal component analysis, self-organizing maps, and clustering algorithms) for processing an...

Claims


Application Information

Patent Timeline
Patent Type & Authority Applications(China)
IPC IPC(8): G06F17/30
CPCG06Q40/04G06F16/26G06T11/206G06T19/00
Inventor A·J·克里斯多夫罗
Owner STATE STREET CORPORATION
Why Eureka
Try Eureka