Graph presentation method of teaching effect
A graphic display and graphic technology, applied in the field of electronic education, to achieve the effect of optimizing the distribution of educational resources, facilitating practical promotion and application, and strong intuition
- Summary
- Abstract
- Description
- Claims
- Application Information
AI Technical Summary
Problems solved by technology
Method used
Image
Examples
Embodiment 1
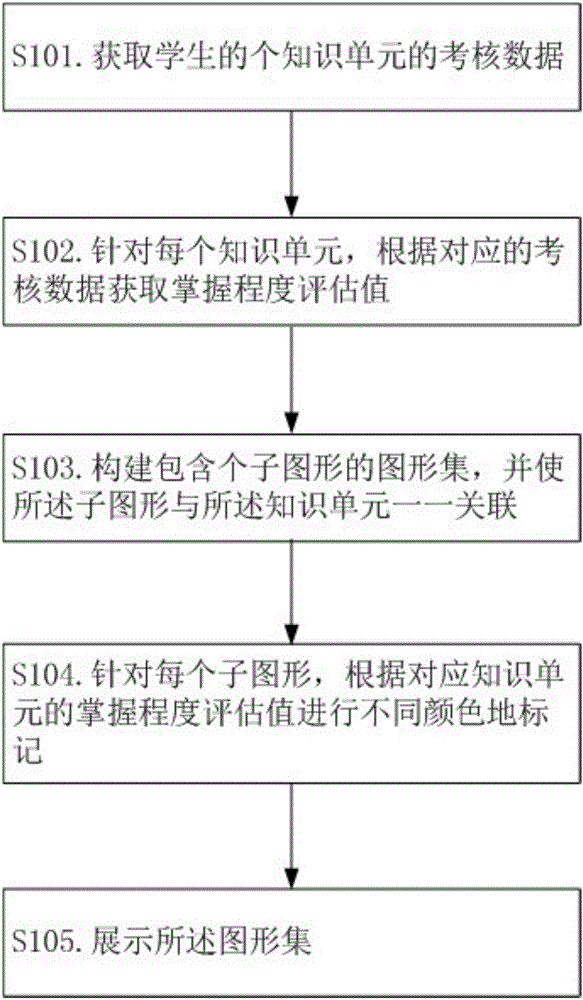
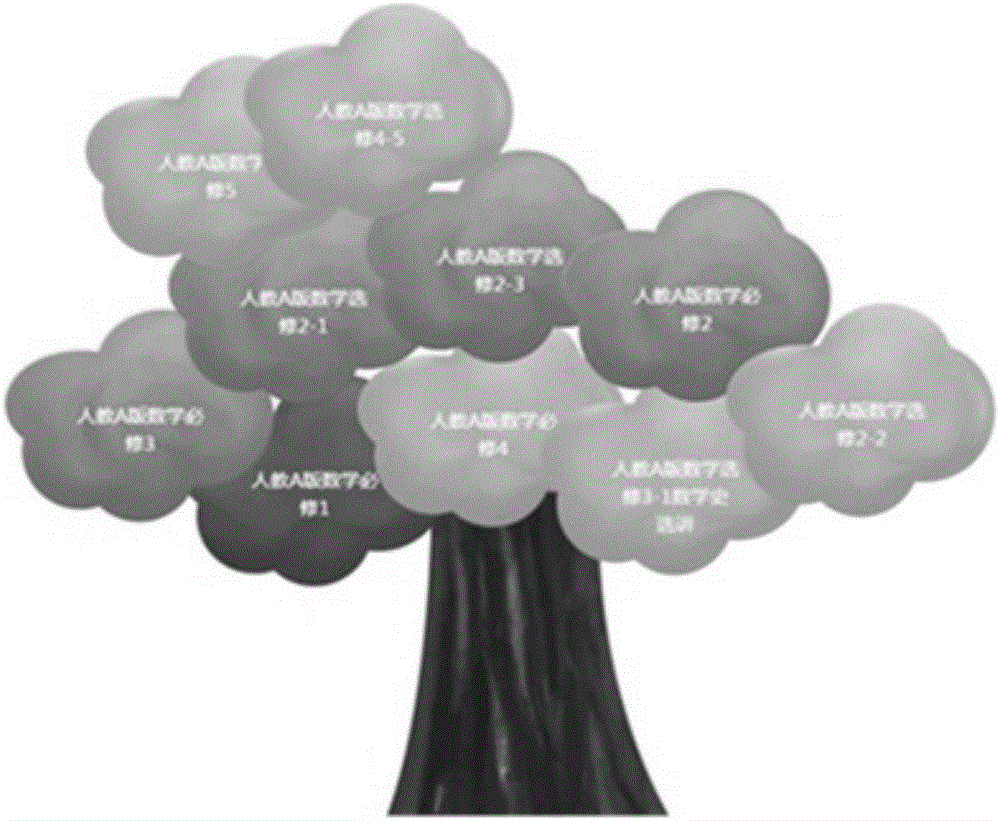
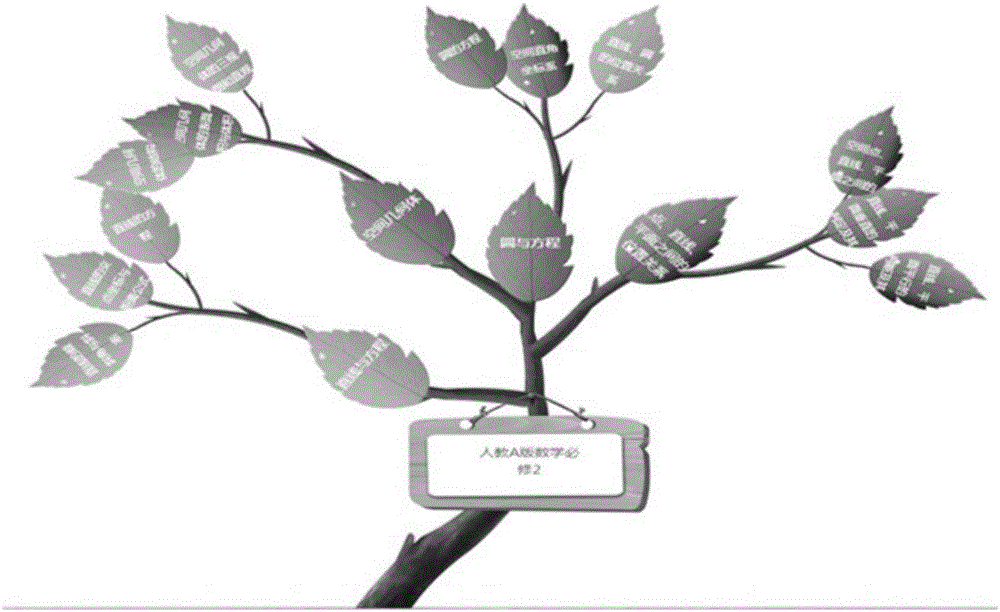
[0025] figure 1 A schematic flow chart showing the graphical presentation method of the teaching effect provided by the present invention, figure 2 It shows the graphic presentation result of the first teaching effect provided by the present invention, image 3 It shows the graphic presentation result of the second teaching effect provided by the present invention. The method for graphically displaying the teaching effect provided in this embodiment includes the following steps.
[0026] S101. Obtain assessment data of N knowledge units of the student, where N is a natural number.
[0027] In step S101, the knowledge unit can be teaching materials at a macro level, such as textbooks published by a publishing house, or more detailed knowledge chapters and knowledge points in knowledge chapters in teaching materials. Optimized, the assessment data includes structured assessment data / and unstructured assessment data, and the structured assessment data may but not limited to i...
PUM
 Abstract
Description
Claims
Application Information
 - R&D
- Intellectual Property
- Life Sciences
- Materials
- Tech Scout
- Unparalleled Data Quality
- Higher Quality Content
- 60% Fewer Hallucinations
Browse by: Latest US Patents, China's latest patents, Technical Efficacy Thesaurus, Application Domain, Technology Topic, Popular Technical Reports.
© 2025 PatSnap. All rights reserved.Legal|Privacy policy|Modern Slavery Act Transparency Statement|Sitemap|About US| Contact US: help@patsnap.com


