Power curve fitting method of wind turbine generator based on optimizing maximum value of probability density

A probability density curve, probability density technology, applied in electrical digital data processing, special data processing applications, instruments, etc., can solve problems such as shutdown, power curve deviation, and complex operating conditions of wind turbines.

Inactive Publication Date: 2017-01-25
NORTH CHINA ELECTRIC POWER UNIV (BAODING)
View PDF4 Cites 18 Cited by
  • Summary
  • Abstract
  • Description
  • Claims
  • Application Information

AI Technical Summary

Problems solved by technology

However, in actual operation, the operating conditions of wind turbines are complex, resulting in the complexity of power data, including downtime caused by fault repairs, power-limited operation of the unit, resulting in a large difference between the generating power of the unit and the actual capacity for a long time, and there may be a small amount of unknown reasons Abnormal output caused by (abnormal sensor records, faulty operation of...

Method used


Image

  • Power curve fitting method of wind turbine generator based on optimizing maximum value of probability density
  • Power curve fitting method of wind turbine generator based on optimizing maximum value of probability density
  • Power curve fitting method of wind turbine generator based on optimizing maximum value of probability density

Examples


Embodiment Construction

[0040] The present invention will be described in further detail below in conjunction with the accompanying drawings.

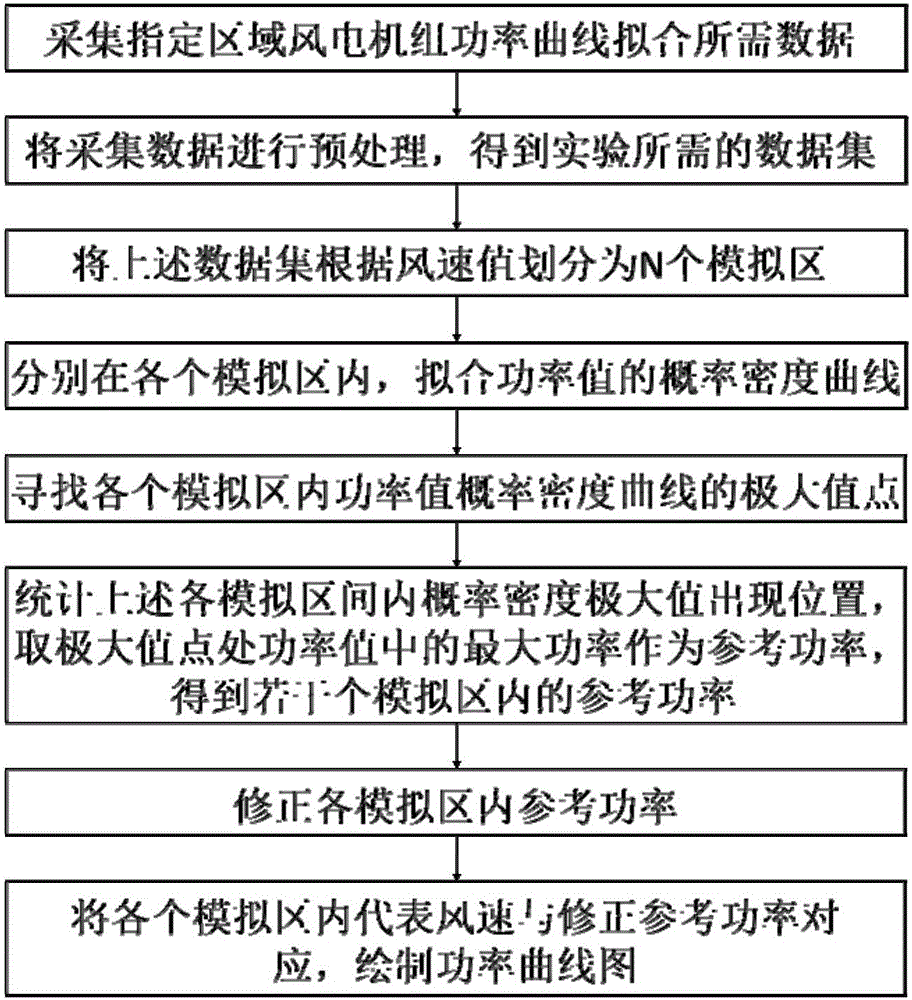
[0041] A wind turbine power curve fitting method based on probability density maximum optimization, comprising the following steps:

[0042] Step 1): Collect the data required for power curve fitting of wind turbines in the specified area;

[0043] The required data includes incoming wind speed and power data at the hub height of the wind turbine, as well as ambient temperature and atmospheric pressure data. In this example, the hub height of the wind turbine is 70m, the cut-in wind speed of the wind turbine is 3m / s, the rated wind speed is 10.3m / s, the cut-out wind speed is 22m / s, and the rated power is 1500kW. Select the data of the wind turbine for 4 consecutive months, and the data resolution is 10 minutes.

[0044] Step 2): Preprocessing the data collected in step 1) to obtain the data set required for the experiment;

[0045] a. According to the ambi...


PUM


Abstract

The invention discloses a power curve fitting method of a wind turbine generator based on optimizing maximum value of probability density, comprising the following steps of: 1) collecting the needed data of wind turbine generator power curve in the appointed area; 2) pre-treating the data collected in step 1) to obtain the data needed by the experiment; 3)dividing the data set obtained in step 2) into N simulation areas; 4) fitting the probability density curve of the power value in each simulation area; 5)searching the maximum point of power value probability density curve in each simulation area, 6) counting the position of maximum position of probability density in many simulation areas, 7) amending the reference power in each simulation area, and 8) corresponding the representative air wind in each simulation to the amended reference power, and drawing the power curve figure.

Description

technical field [0001] The invention belongs to the technical field of wind power generation, in particular to a method for fitting power curves of wind turbines based on the optimization of the maximum value of probability density. Background technique [0002] The actual power curve of the wind turbine is a curve describing the corresponding relationship between the output power of the unit and the incoming wind speed during operation, reflecting the actual power generation capacity of the unit under normal operating conditions, and can usually be used to evaluate the operating performance of the unit and assess the power generation efficiency of the wind turbine. In addition, in the fields of wind power prediction and unit failure warning, the actual power curve of wind turbines also has important applications. [0003] The power curve provided by the unit manufacturer is a static power curve obtained through testing under standard environmental conditions, which reflects...

Claims


Application Information

Patent Timeline
IPC IPC(8): G06Q50/06G06F19/00
CPCG06Q50/06G16Z99/00
Inventor 韩爽延平刘永前阎洁张浩李莉孙绪江
Owner NORTH CHINA ELECTRIC POWER UNIV (BAODING)
Why Eureka
Try Eureka