
Network quality performance display method, device and system

A network quality and display device technology, which is applied in the field of network communication, can solve the problems such as the inability to display multiple network quality and performance data of multiple network lines, so as to solve the problem of reduced visibility and maintainability, clear display, and improved maintainability Effect

Inactive Publication Date: 2017-11-24
ZTE CORP
View PDF0 Cites 4 Cited by
  • Summary
  • Abstract
  • Description
  • Claims
  • Application Information

AI Technical Summary

Problems solved by technology

[0003] The present invention provides a network quality performance display method, device, and system to solve the technical problem that multiple network lines and various network quality performance data cannot be displayed in the prior art

Method used


Image

  • Network quality performance display method, device and system
  • Network quality performance display method, device and system
  • Network quality performance display method, device and system

Examples


Embodiment 1

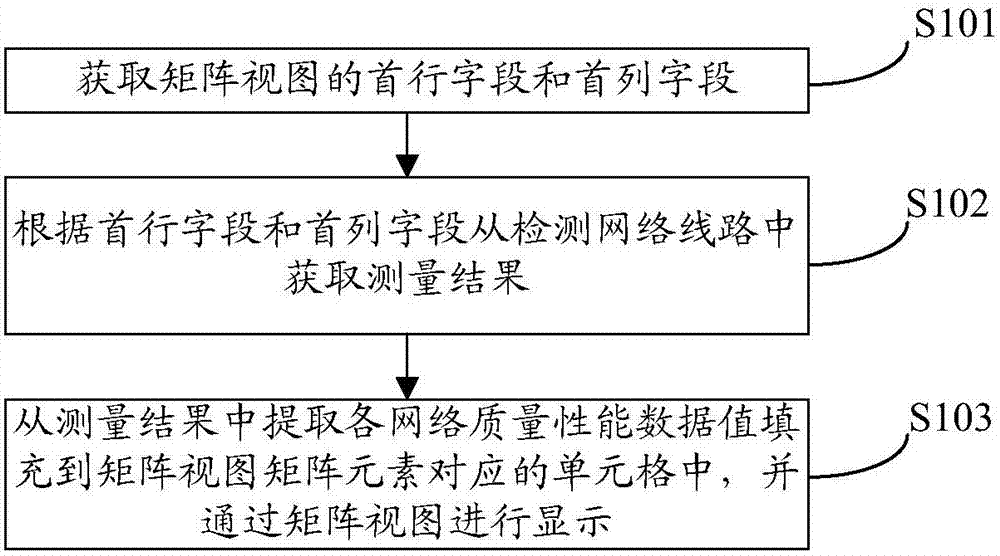
[0048] At present, in the process of detecting and displaying network quality and performance, the detected network performance data is displayed in the form of a trend curve. For multiple performance indicators or multiple network lines, the The display on the unified coordinate axis will cause confusion, and the user cannot monitor the performance of the network intuitively through the display of the curve. In this regard, this embodiment provides a method for displaying network quality performance. For details, please refer to figure 1 , the network quality performance display method includes the following steps:

[0049] S101. Acquire the first row field and the first column field of the matrix view.

[0050] In this embodiment, before obtaining the first row field and the first column field of the matrix view, the matrix view must be set first, and the matrix view can be set on the client, or it can be set on the network quality performance for monitoring the network lin...

Embodiment 2

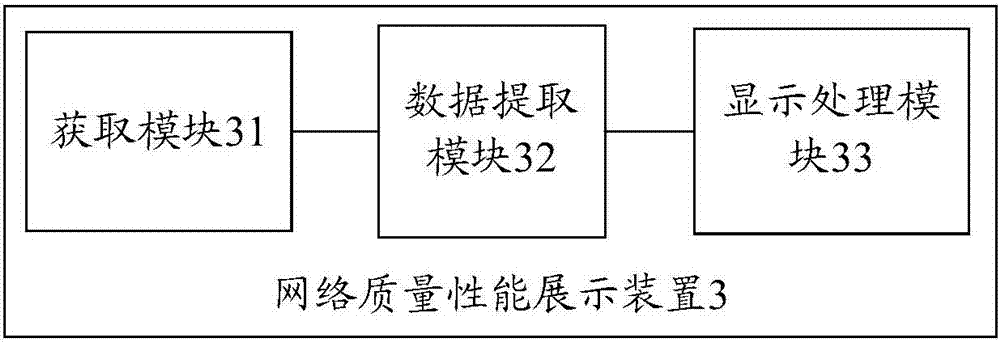
[0100] Please refer to image 3 , image 3 The structural block diagram of the network quality performance display device provided in this embodiment, the device 3 includes: an acquisition module 31, a data extraction module 32 and a display processing module 33, wherein:

[0101] The obtaining module 31 is used to obtain the first row field and the first column field of the matrix view;

[0102] Specifically, in this embodiment, the field in the first row is the source node of each detected network line, and the field in the first column is the destination node of each detected network line; further, the matrix view also includes matrix elements, and the matrix elements are specifically Determine a matrix element in the matrix view through a first row field and a first column field, and the matrix element is the network quality performance data value of the detected network line;

[0103] In this embodiment, the device 3 also includes a setting module 39, which is used to d...


PUM


Abstract

The invention discloses a network quality performance display method, device and system. The network quality performance display method comprises the following steps: obtaining a first row field and a first column field of a matrix view; obtaining a detection result from a detection network according to the first row field and the first column field; extracting each network quality performance data value from the detection results and filling into the matrix view; and displaying the filled network quality performance data value through the matrix view. According to the invention, the network quality performance data of the detection network is displayed in real time by setting the matrix view, therefore, the confusion problem of displaying multiple performance data or performance data of multiple network lines in the same matrix view is solved; and the network can be monitored by the user in real time through the matrix view, therefore, the problem of reducing the visibility and maintainability of the system because of the complex view display is solved, the changes of the network quality performance can be displayed visually, timely and clearly by means of the network performance data, and the workload of the user during network monitoring is reduced.

Description

technical field [0001] The present invention relates to the technical field of network communication, in particular to a network quality performance display method, device and system. Background technique [0002] In the PTN (Packet Transport Network, Packet Transport Network) network quality management process, it is often necessary to display the quality performance data of the network in real time and monitor the dynamic changes of the quality performance data. Currently, trend graphs are mostly used for network monitoring and display. However, if many network lines are monitored, and each network line involves multiple network quality and performance indicators, the current trend graph display method will cause too many curves. There are too many corresponding coordinate axes. Even if the coordinate axes are merged, the curve trend will be confused due to extreme conditions such as data abnormalities. It is impossible to analyze the network quality of the current network...

Claims


Application Information

Patent Timeline
Patent Type & Authority Applications(China)
IPC IPC(8): H04L12/24H04L12/26
CPCH04L41/0631H04L41/14H04L41/22H04L43/16
Inventor 孙权胡常举王丹刘万慧
Owner ZTE CORP
Learn More