
Method and system for calculating carbon emission peak value based on energy consumption structure optimization

A technology of consumption structure and calculation method, applied in the field of energy economic research, can solve the problem of inability to accurately predict the movement of carbon emission peak, and achieve the effect of more reliable carbon emission peak prediction

Inactive Publication Date: 2018-01-19
STATE GRID ZHEJIANG ELECTRIC POWER COMPANY ECONOMIC TECHN INST +1
View PDF2 Cites 9 Cited by
  • Summary
  • Abstract
  • Description
  • Claims
  • Application Information

AI Technical Summary

Problems solved by technology

The Kuznets curve can measure the scale range and time range of carbon emission peaks, but it cannot accurately predict the movement of carbon emission peaks when environmental governance and energy policies change

Method used


Image

  • Method and system for calculating carbon emission peak value based on energy consumption structure optimization
  • Method and system for calculating carbon emission peak value based on energy consumption structure optimization
  • Method and system for calculating carbon emission peak value based on energy consumption structure optimization

Examples


Embodiment 1

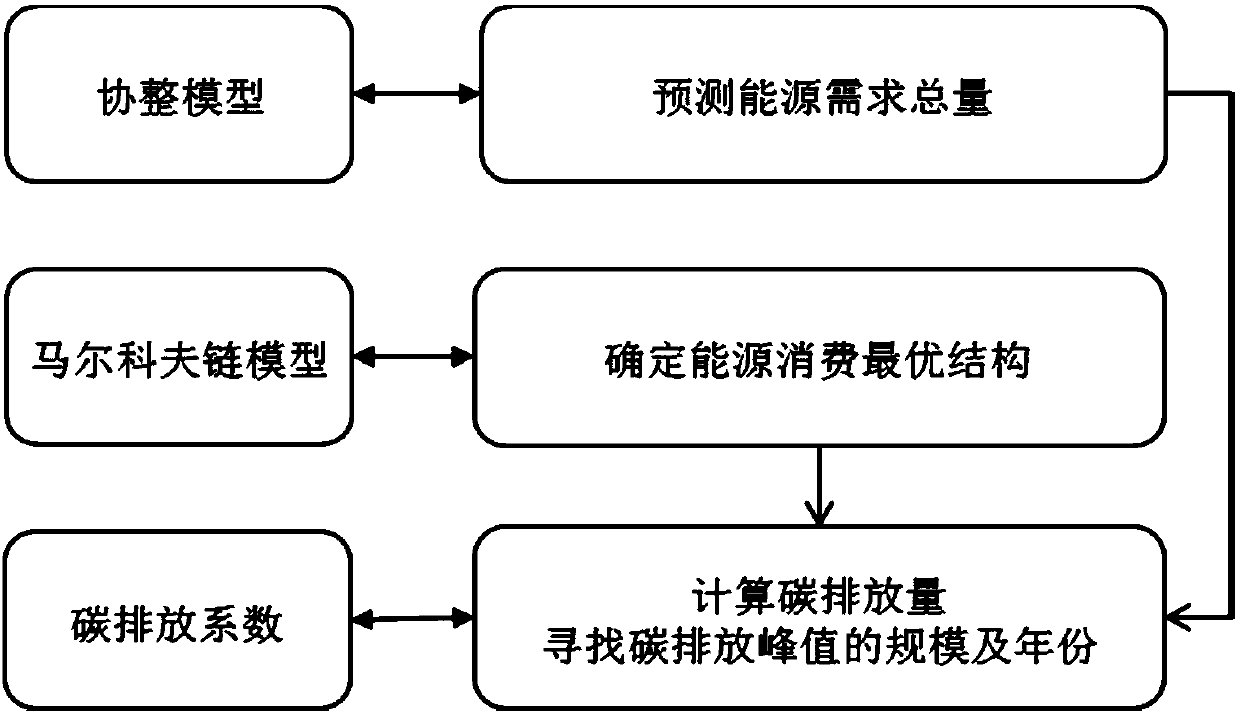
[0042] The present invention is a calculation method of peak carbon emission based on optimization of energy consumption structure, such as figure 1 As shown, the steps are as follows:

[0043] 1. Select appropriate influencing factors, construct a co-integration model, and predict the total energy consumption given different scenarios;

[0044] 11) The factors that affect energy demand include economic development level, industrial structure, energy efficiency improvement, energy price effect, urbanization level, etc., establish the expression of energy consumption function:

[0045] Qt=f(Yt, Mt, EFt, Pt, Ct),

[0046] In the formula, Qt represents primary energy consumption; Yt represents GDP; Mt represents the ratio of added value of heavy industry to GDP; EFt represents the ratio of added value of industrial production to industrial energy consumption; Pt represents the growth rate of the coal price index, Ct Indicates the level of urbanization. To analyze the needs of the prob...

Embodiment 2

[0075] This embodiment provides a carbon emission peak calculation system based on optimization of energy consumption structure, including:

[0076] 1) Total energy consumption forecast module: select appropriate influencing factors, build a co-integration model, and predict total energy consumption given different scenarios;

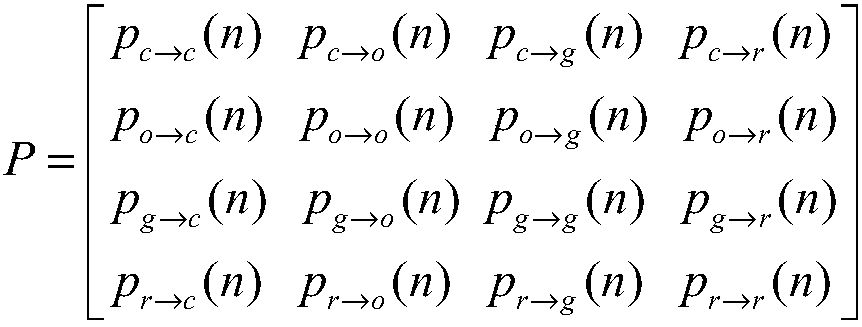
[0077] 2) Energy consumption optimal structure measurement module: Under the natural evolution and planning constraint scenarios, the Markov chain model is used to calculate the optimal energy consumption structure;

[0078] 3) Carbon emission calculation module: adopting the international standard carbon emission coefficient and calculating the carbon emission under different scenarios based on the results obtained in the first two steps, looking for the scale and year of the peak carbon emission.


PUM


Abstract

The invention discloses a method and a system for calculating a carbon emission peak value based on energy consumption structure optimization. A scale interval and an occurrence time range of the carbon emission peak value can be calculated by an existing Kuznets curve. However, the movement of the carbon emission peak value cannot be accurately estimated when environmental governance is carried out and an energy policy changes. The technical scheme adopted by the method comprises the steps of (1) constructing a co-integration model and predicting total energy consumption; (2) calculating an optimal energy consumption structure by use of a Markov chain model under the situation of natural evolution and planning constraint; and (3) calculating carbon emissions under different situations according to results obtained in the previous two steps by use of an international standard carbon emission coefficient, and finding out the scale and the occurrence year of the carbon emission peak value. According to the calculation method, the carbon emission peak value is calculated based on the energy consumption structure optimization, the relation among economic development, energy consumptionand environmental constraint is comprehensively balanced, and the formulation of an energy development strategy can be supported.

Description

Technical field [0001] The invention relates to the field of energy economic research, in particular to a method and system for calculating peak carbon emissions based on the optimization of energy consumption structure. Background technique [0002] In November 2014, a Sino-US joint statement stated that China "plans to reach a peak in carbon dioxide emissions around 2030 and will strive to reach the peak as soon as possible." Existing studies have mostly adopted Kuznets curve fitting and predicted carbon dioxide emissions based on per capita GDP. However, the characteristics of economic development and industrial structure of various countries are different, and the conditions and scale of peaking are not only related to the level of economic development, but also to energy. Other factors such as consumption structure are also closely related. The Kuznets curve can measure the scale and time range of peak carbon emissions, but it cannot accurately predict the movement of peak ...

Claims


Application Information

Patent Timeline
Patent Type & Authority Applications(China)
IPC IPC(8): G06Q10/04
CPCY02P90/84
Inventor 刘卫东黄锦华兰洲龙厚印孙可张笑弟孙飞飞沈志恒吴俊利
Owner STATE GRID ZHEJIANG ELECTRIC POWER COMPANY ECONOMIC TECHN INST
Learn More