Association graph visual analysis method and system based on conversion

An analysis method and correlation graph technology, applied in the field of information visualization, can solve the problem that description and exploration cannot be realized at the same time, and achieve the effect of reducing visual complexity.

Active Publication Date: 2018-08-03
BEIJING TECHNOLOGY AND BUSINESS UNIVERSITY
View PDF5 Cites 15 Cited by
  • Summary
  • Abstract
  • Description
  • Claims
  • Application Information

AI Technical Summary

Problems solved by technology

[0007] Existing visualization methods are often unable to realize the description and exploration of complex associations, highlight key objects, and comprehensively display associated information when solving the visual analysis of associated data.

Method used


Image

  • Association graph visual analysis method and system based on conversion
  • Association graph visual analysis method and system based on conversion
  • Association graph visual analysis method and system based on conversion

Examples


Embodiment Construction

[0068] The following will further describe the present invention through examples in conjunction with the accompanying drawings, but the scope of the present invention is not limited in any way.

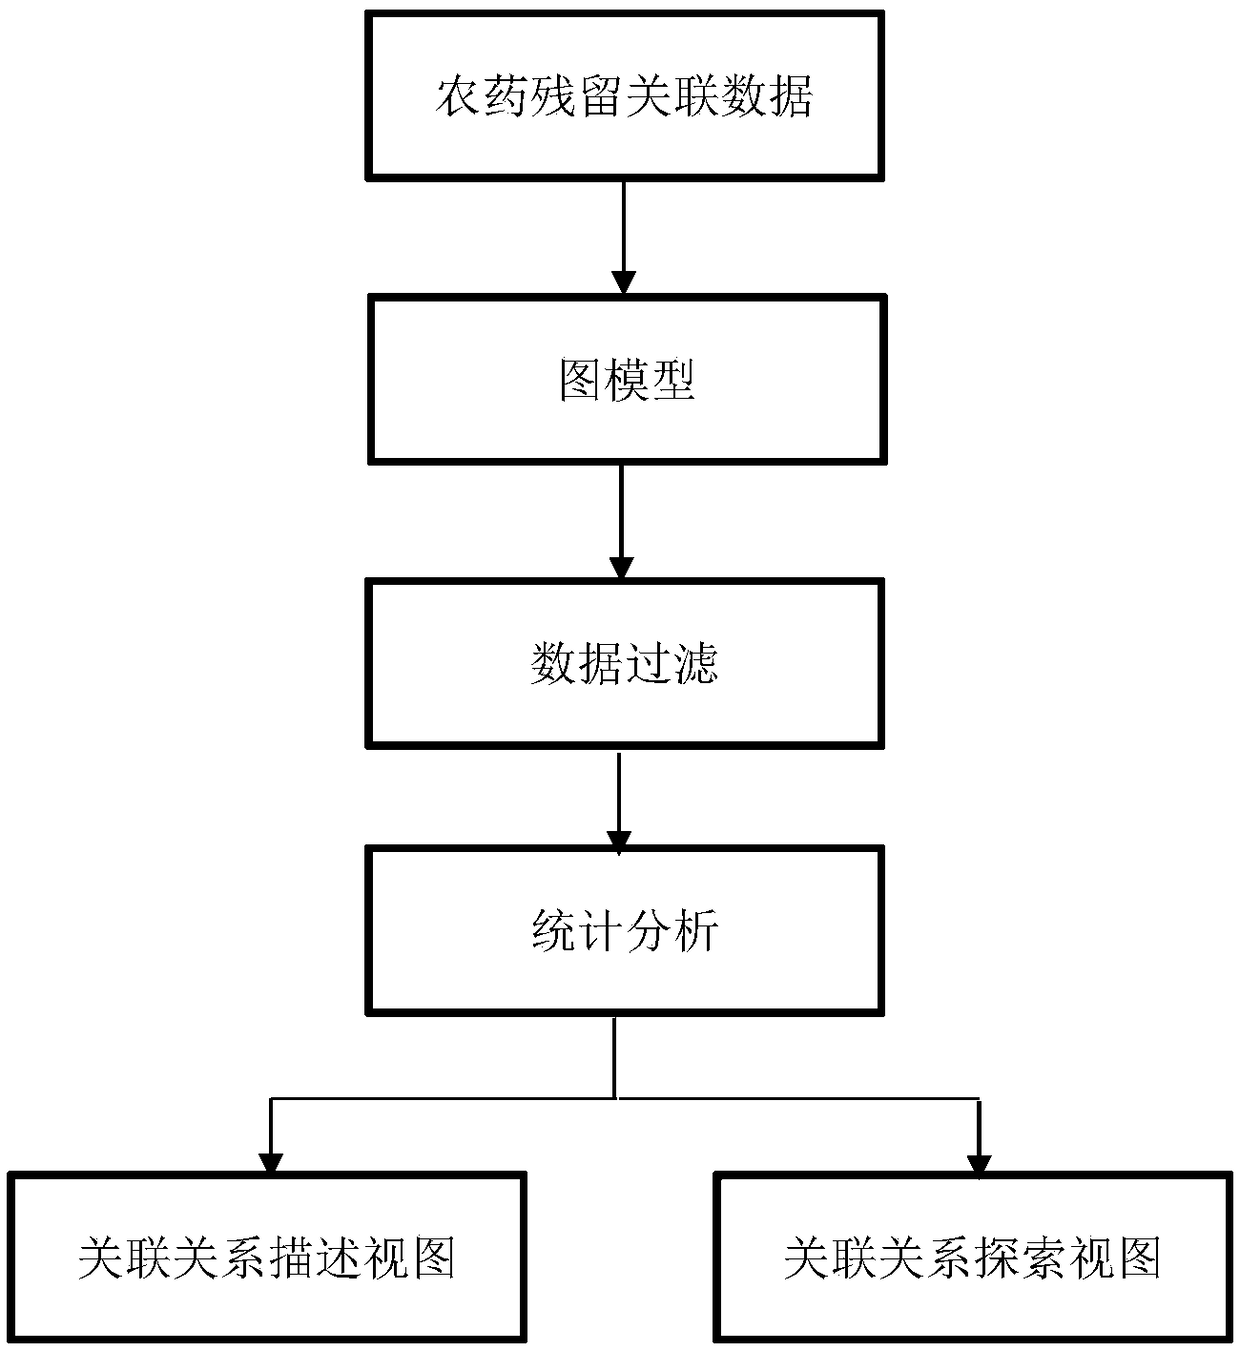
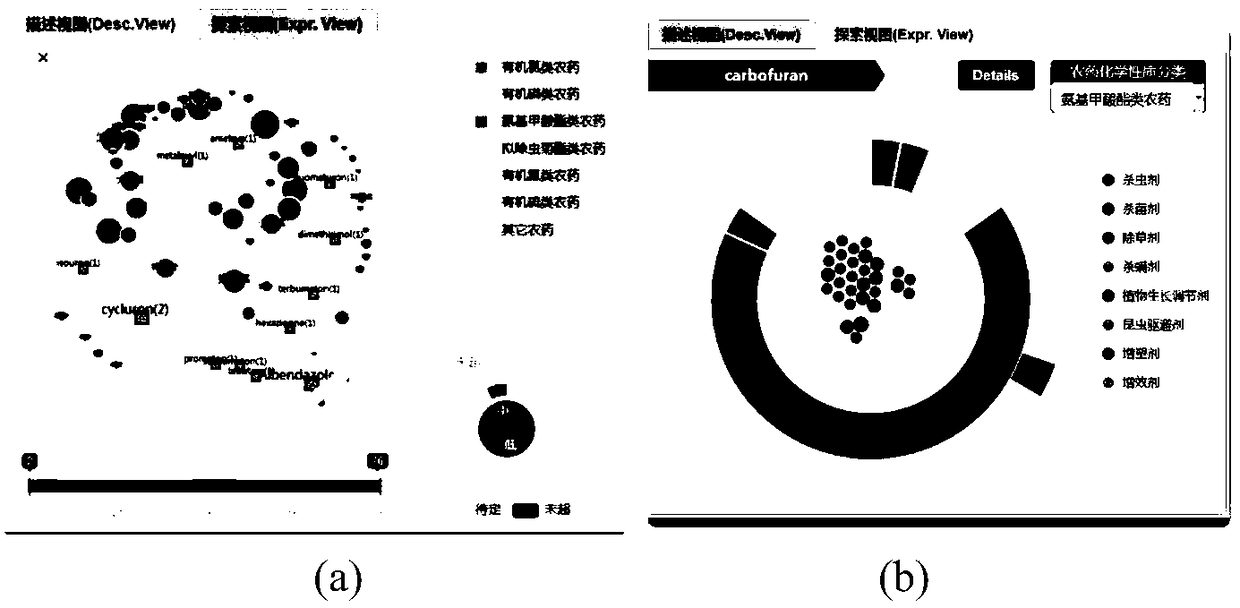
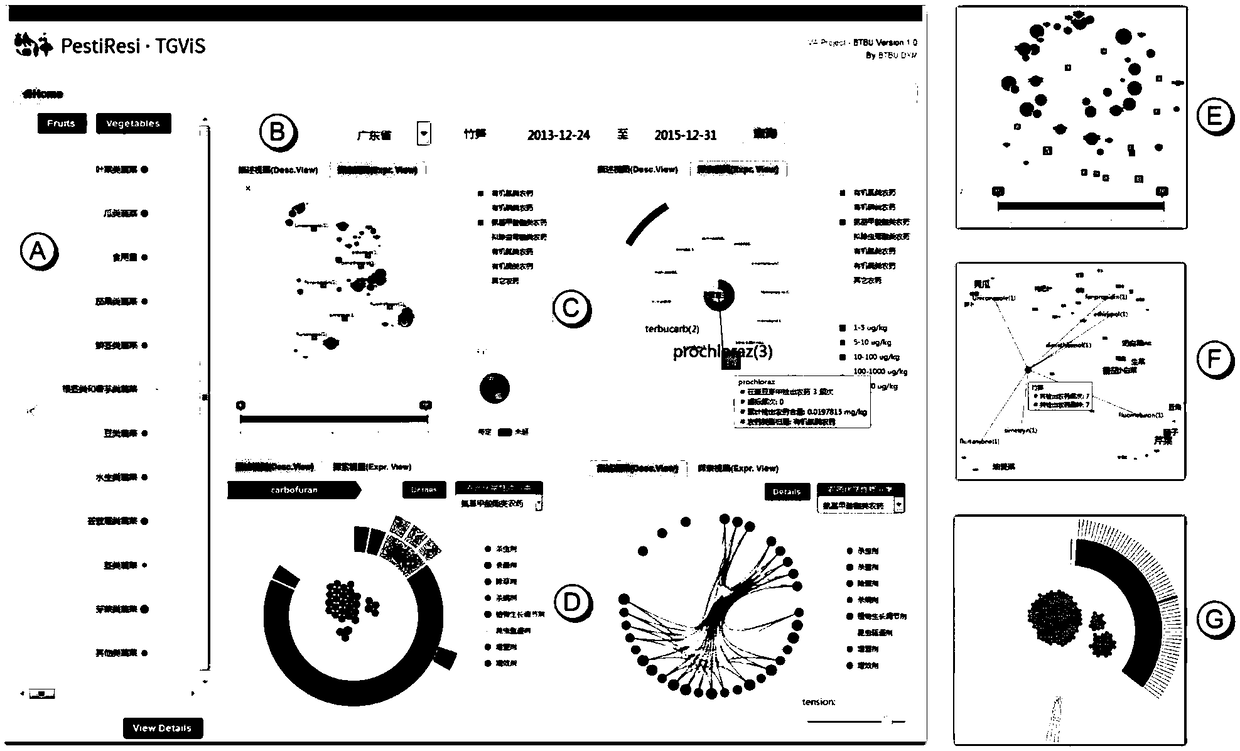
[0069] The present invention provides a transform-based visual analysis method, system and application of an association graph, which displays complex associations in data sets from the perspectives of association description and exploration (such as figure 2shown), using force-guided layout methods (node-link graphs), graph simplification techniques (K-means clustering, fisheye transformation techniques based on graph topology, graph filtering and edge binding techniques) and graph visualization The interaction design (focus + context technology, pan and zoom technology, global + detail technology and interactive dynamic filtering). The method of the invention can solve the problem of visual confusion easily caused by edge intersections when expressing complex associations, highlig...


PUM


Abstract

The invention discloses an association graph visual analysis method and system based on conversion and application. A data concentration complex association is displayed by two views of association description and association exploration in an association graph TransGraph, by using a layout method based on force guide, a graph simplification technology and interaction design in graph visualization, association information of data is subjected to visual analysis, the problem is solved that visual confusion is easily caused by edge cross during the complex association, key supervision objects are highlighted, the association information is comprehensively displayed, and accordingly the method can effectively assist analysis personnel in making a decision. The visual analysis method can be applied to visual analysis of a pesticide residue detection result dataset, and the pesticide residue data association visual analysis system implemented by using the visual analysis method is provided.

Description

technical field [0001] The invention belongs to the field of information visualization, and relates to a data visual analysis method, in particular to a transform-based visual analysis method of an association graph and a system thereof. Background technique [0002] Correlation has always been an important research object of data analysis, and exists in various fields in the real world. Taking pesticide residue data as an example, it consists of two disjoint sets of pesticides and agricultural products. At the same time, the relationship between pesticides and agricultural products There is a residual relationship between them. Graphs are a common mathematical method used to model relationships, which can effectively summarize the connections between things at a high level. From a visualization perspective, graph visualization is also an important branch of the field of information visualization. Also known as association network, network or association graph, it is the co...

Claims


Application Information

Patent Timeline
Patent Type & Authority Applications(China)
IPC IPC(8): G06F17/30G06K9/62
CPCG06F16/26G06F18/23213
Inventor 陈谊杜晓敏管泽礼
Owner BEIJING TECHNOLOGY AND BUSINESS UNIVERSITY
Why Eureka
Try Eureka