Traffic state thermogram visualization method based on traffic saturation

A technology of traffic situation and saturation, applied in the field of transportation, can solve the problems such as the small proportion of trajectory data and the inability to effectively display trajectory data of traffic situation, and achieve the effect of easy calculation, low cost and simple operation

Active Publication Date: 2018-08-14
KUNMING UNIV OF SCI & TECH
View PDF6 Cites 3 Cited by
  • Summary
  • Abstract
  • Description
  • Claims
  • Application Information

AI Technical Summary

Problems solved by technology

[0003] In order to overcome the limitation that the traffic situation cannot be effectively displayed when the proportion of trajectory data is small or cannot be effectively collected, and the visualization of trajectory data mostly estimates the traffic situation on road sections, the present invention provides a traffic saturation-based The traffic situation heat map visualization method uses the point data collected by video, coils, geomagnetism, etc. in traffic management, and comprehensively considers the traffic congestion status of intersections and road sections in the road network, so as to effectively visualize the traffic situation

Method used


Image

  • Traffic state thermogram visualization method based on traffic saturation
  • Traffic state thermogram visualization method based on traffic saturation
  • Traffic state thermogram visualization method based on traffic saturation

Examples


Embodiment Construction

[0045] The present invention will be further described below in combination with the accompanying drawings and specific embodiments.

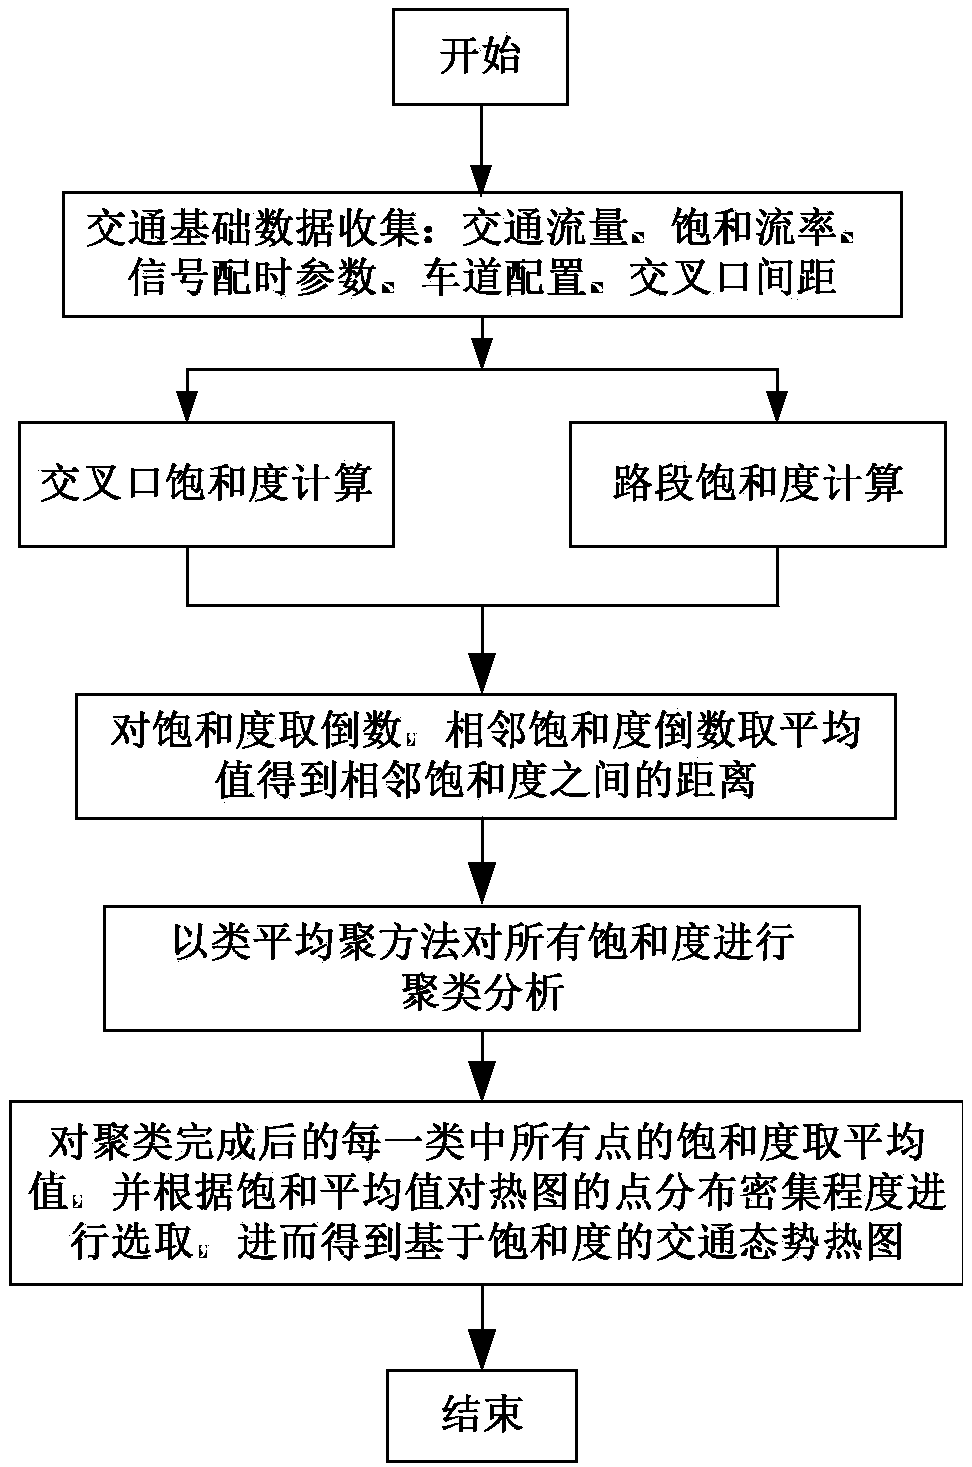
[0046] A traffic saturation heat map visualization method based on traffic saturation of the present invention, such as figure 1 shown, including:

[0047] Step 1: Collect basic traffic data within the analysis period, which includes traffic flow at each intersection, signal timing parameters, saturation flow rate at each entrance, lane configuration, and intersection spacing;

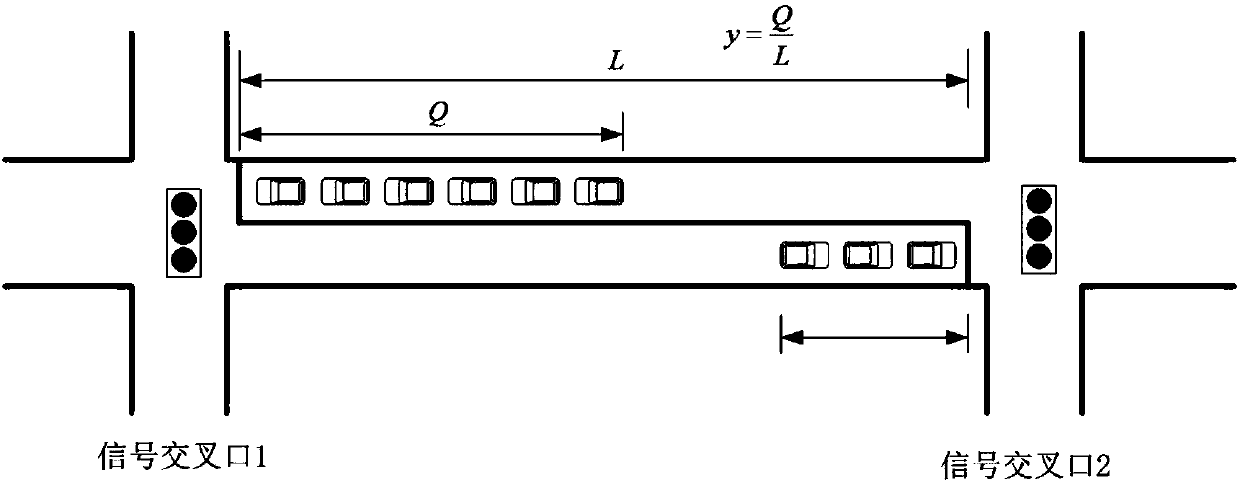
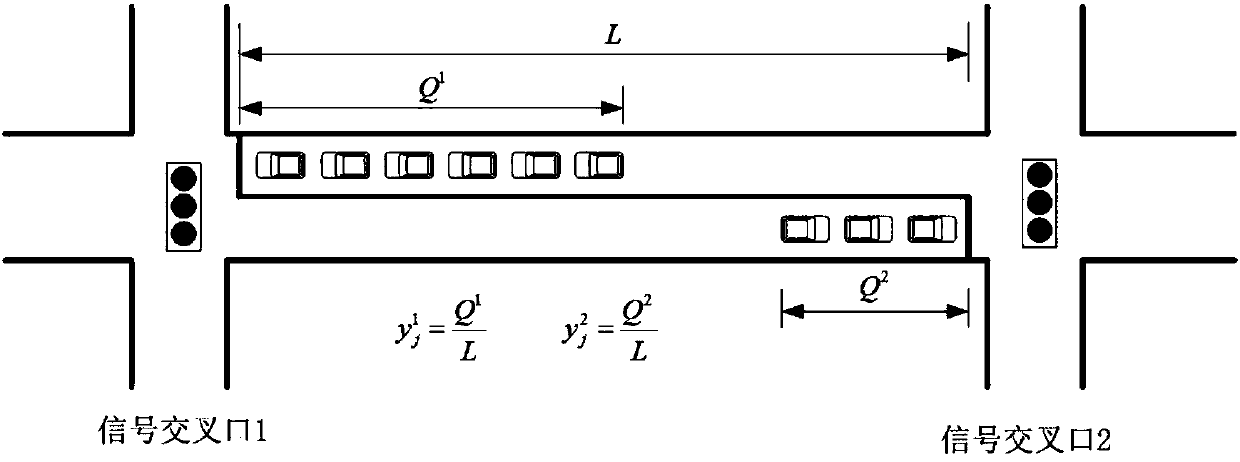
[0048] Step 2: Calculate the saturation of each intersection and the saturation of each road segment;

[0049] Step 3: Take the reciprocal of the saturation, and take the average of the reciprocals of adjacent saturations to obtain the distance between adjacent saturations;

[0050] Step 4: Cluster all saturations in the road network with the class average clustering method;

[0051] Step 5: Take the average of the saturation of all points in each class after the clu...


PUM


Abstract

The invention relates to a traffic state thermogram visualization method based on traffic saturation, and belongs to the technical field of traffic. The method includes acquiring the point data of a video, a coil, a geomagnetic field in the traffic management, and calculating the saturation of the intersection and the road section in the road network, adopting an average clustering analysis method, dividing the class of all the saturation in the road network, and calculating the values of the saturation in various classes again, and selecting the point distribution density degree of the thermogram according to the saturation average value so as to obtain the traffic state thermogram based on the traffic saturation. The method has the advantages that the operation is simple, the calculationis convenient, and the defect that the proportion of the track data is small, the precision is low or the traffic state cannot be effectively displayed under the condition of ineffective acquisitioncan be made up, and meanwhile, the condition of the traffic bearing capacity of the intersection and the road section is considered, the traffic state can be visually displayed more fully and reasonably, and a support is provided for the scheme decision of the traffic manager.

Description

technical field [0001] The invention relates to a traffic saturation heat map visualization method, which belongs to the technical field of traffic. Background technique [0002] Traffic heat map is a macroscopic visualization method of road network traffic congestion. Scientific and reasonable visualization of traffic situation can help traffic managers control the traffic state, and make effective decisions on traffic plans according to the traffic state to alleviate traffic congestion. , the purpose of optimizing the travel environment. Most of the existing traffic situation heat map visualization methods are obtained from trajectory data such as floating car data and map navigation. However, when the proportion of trajectory data is small or cannot be effectively collected, it will not be able to effectively display the traffic situation; in addition, When the proportion of trajectory data is small, the estimated parameters (travel time, flow rate, queue length, etc.) r...

Claims


Application Information

Patent Timeline
Patent Type & Authority Applications(China)
IPC IPC(8): G08G1/01
CPCG08G1/0125
Inventor 李冰成卫付诗诗肖海承陈之锴
Owner KUNMING UNIV OF SCI & TECH
Why Eureka
Try Eureka