Supercharge Your Innovation With Domain-Expert AI Agents!

Method of evaluating use case graph on basis of difference comparison

A technology of difference comparison and use case diagram, which is applied in software design and other directions

Active Publication Date: 2018-09-07
EAST CHINA NORMAL UNIVERSITY
View PDF4 Cites 0 Cited by
  • Summary
  • Abstract
  • Description
  • Claims
  • Application Information

AI Technical Summary

Problems solved by technology

However, these measurement methods are basically used in the software development stage or the software completion stage. In the software life cycle, the earlier the quality defects are found, the less the cost will be. measure its quality

Method used


Image

  • Method of evaluating use case graph on basis of difference comparison
  • Method of evaluating use case graph on basis of difference comparison
  • Method of evaluating use case graph on basis of difference comparison

Examples


Embodiment

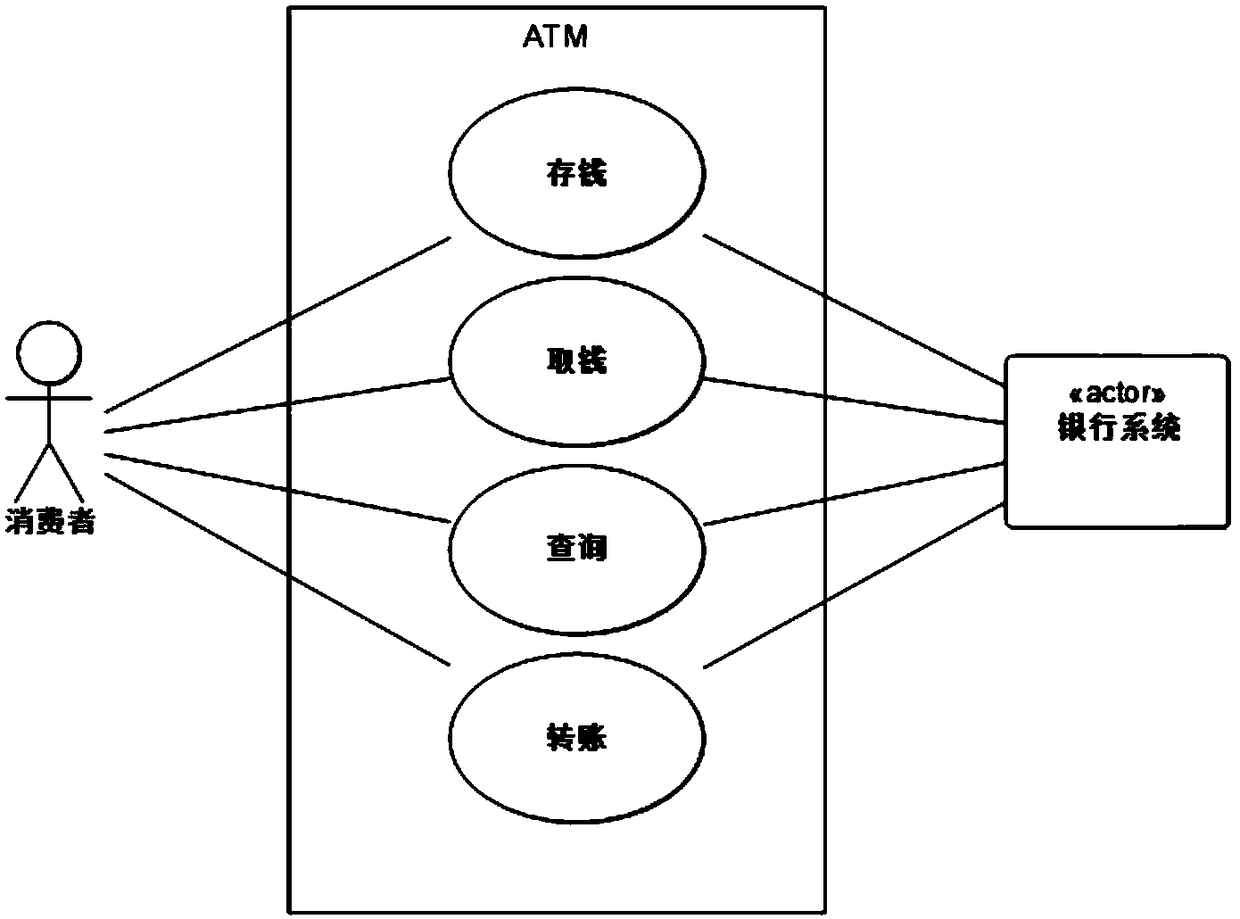
[0056] In order to describe each step of the present invention in detail, this embodiment selects the ATM system as an example for description. A standard ATM system includes 2 participants: consumers, banking system, 1 system boundary: ATM, 4 use cases deposit, transfer, withdraw money, query, and the relationship between 8 participants and use cases. The types of relationships are all for ordinary relationships.

[0057] Embodiments of the present invention are described below in conjunction with the accompanying drawings:

[0058] Step 1: Define the evaluation indicators, scoring rules and scoring formulas of the use case diagram

[0059] Defined out of 10 points. Among them, the score for the participant who is correct is 0.5, and the highest score is 1 point; the score for the correct use case is 1 point, and the highest score is 4 points; the score for the correct system boundary is 1 point, and the highest score is 1 point; A score of 0.5 points is given for a correc...


PUM


Abstract

The invention discloses a method of evaluating a use case graph on the basis of difference comparison. The method is used for obtaining, by comparison, differences between use case graphs (products ofa user requirement stage) of different development teams for the same field and a standard use case graph, completing evaluation on the different use case graphs, and obtaining evaluation of softwarequality. When the use case graph is evaluated, the method includes: (1) defining evaluation indexes, scoring detailed-rules and scoring formulas according to a meta-model of the use case graph; (2) using XML documents, which correspond to the standard use case graph and the to-be-evaluated use case graph, as input to extract data, which are used for comparison, from the XML documents according tothe evaluation indexes; (3) carrying out difference comparison on the data of the standard use case graph and the to-be-evaluated use case graph according to synonyms; and (4) bringing a result of difference comparison into the scoring formulas to calculate a score, wherein the higher a score value is, the better the designed to-be-evaluated use case graph will be. According to the method, functional flaws of designed software are found in an early stage through comparison on the use case graphs, and quality of the software is measured.

Description

technical field [0001] The invention belongs to the technical field of software quality measurement, and specifically relates to a method for evaluating and scoring the use case diagram, an intermediate product in the demand stage of software development, by using difference comparison, and measuring the quality of software design through the score. Background technique [0002] With the maturity and diversification of software development methods, software has been widely used in various industries. There are more and more software in the industry, and the quality is uneven. Therefore, under the condition of maximizing cost and benefit, how to measure the quality of a software, choose the most suitable software for the user, and guide the further development of the developer is particularly important. . [0003] At present, there are many methods of software measurement, such as from the object-oriented point of view, defining a large number of measurement indicators to me...

Claims


Application Information

Patent Timeline
IPC IPC(8): G06F8/20
CPCG06F8/20
Inventor 文涛陈小红
Owner EAST CHINA NORMAL UNIVERSITY
Features
  • R&D
  • Intellectual Property
  • Life Sciences
  • Materials
  • Tech Scout
  • Unparalleled Data Quality
  • Higher Quality Content
  • 60% Fewer Hallucinations
Learn More