A Visual Method for Fault Segmentation in Distribution Network

A technology for distribution network faults and sections, applied to electrical components, circuit devices, AC network circuits, etc., can solve problems such as errors, influence of power system reliability evaluation, and lack of visualization

Active Publication Date: 2020-03-17
福建永福信息科技有限公司
View PDF11 Cites 0 Cited by
  • Summary
  • Abstract
  • Description
  • Claims
  • Application Information

AI Technical Summary

Problems solved by technology

[0005] (1) It cannot be applied to situations where new technologies such as distribution network automation transformation, renewable energy grid integration, distributed power generation technology, DC transmission, flexible AC transmission technology, etc. may affect the reliability of the power system; for power grid lines The topological structure is only suitable for reliability assessment of simple radial feeder systems, and is not suitable for analysis of mesh topological structures; new power market policies such as changes in the competition management system, separation of power plants and power grids, and separation of power transmission and distribution may affect power. impact on system reliability assessments, studies must be adjusted accordingly
[0006] (2) The minimum path method based on DFS is based on the idea of ​​fault enumeration, so it is only suitable for reliability evaluation of simple radial feeder systems, so more new algorithms need to be studied
The time-series Monte Carlo method has a contradiction between calculation accuracy and calculation speed. In order to obtain higher-precision calculation results, a large number of sampling calculations are often required, which greatly limits the calculation speed of the evaluation system;
[0007] (3) The single-line diagram model of the distribution network is separated from the data, the model itself lacks element information, and the data needs to be re-imported when performing power supply reliability analysis. It is difficult for engineering designers to find large errors caused by abnormalities, and it is easy to cause large errors

Method used


Image

  • A Visual Method for Fault Segmentation in Distribution Network
  • A Visual Method for Fault Segmentation in Distribution Network
  • A Visual Method for Fault Segmentation in Distribution Network

Examples


Embodiment Construction

[0091] The present invention will be further described below in conjunction with the accompanying drawings.

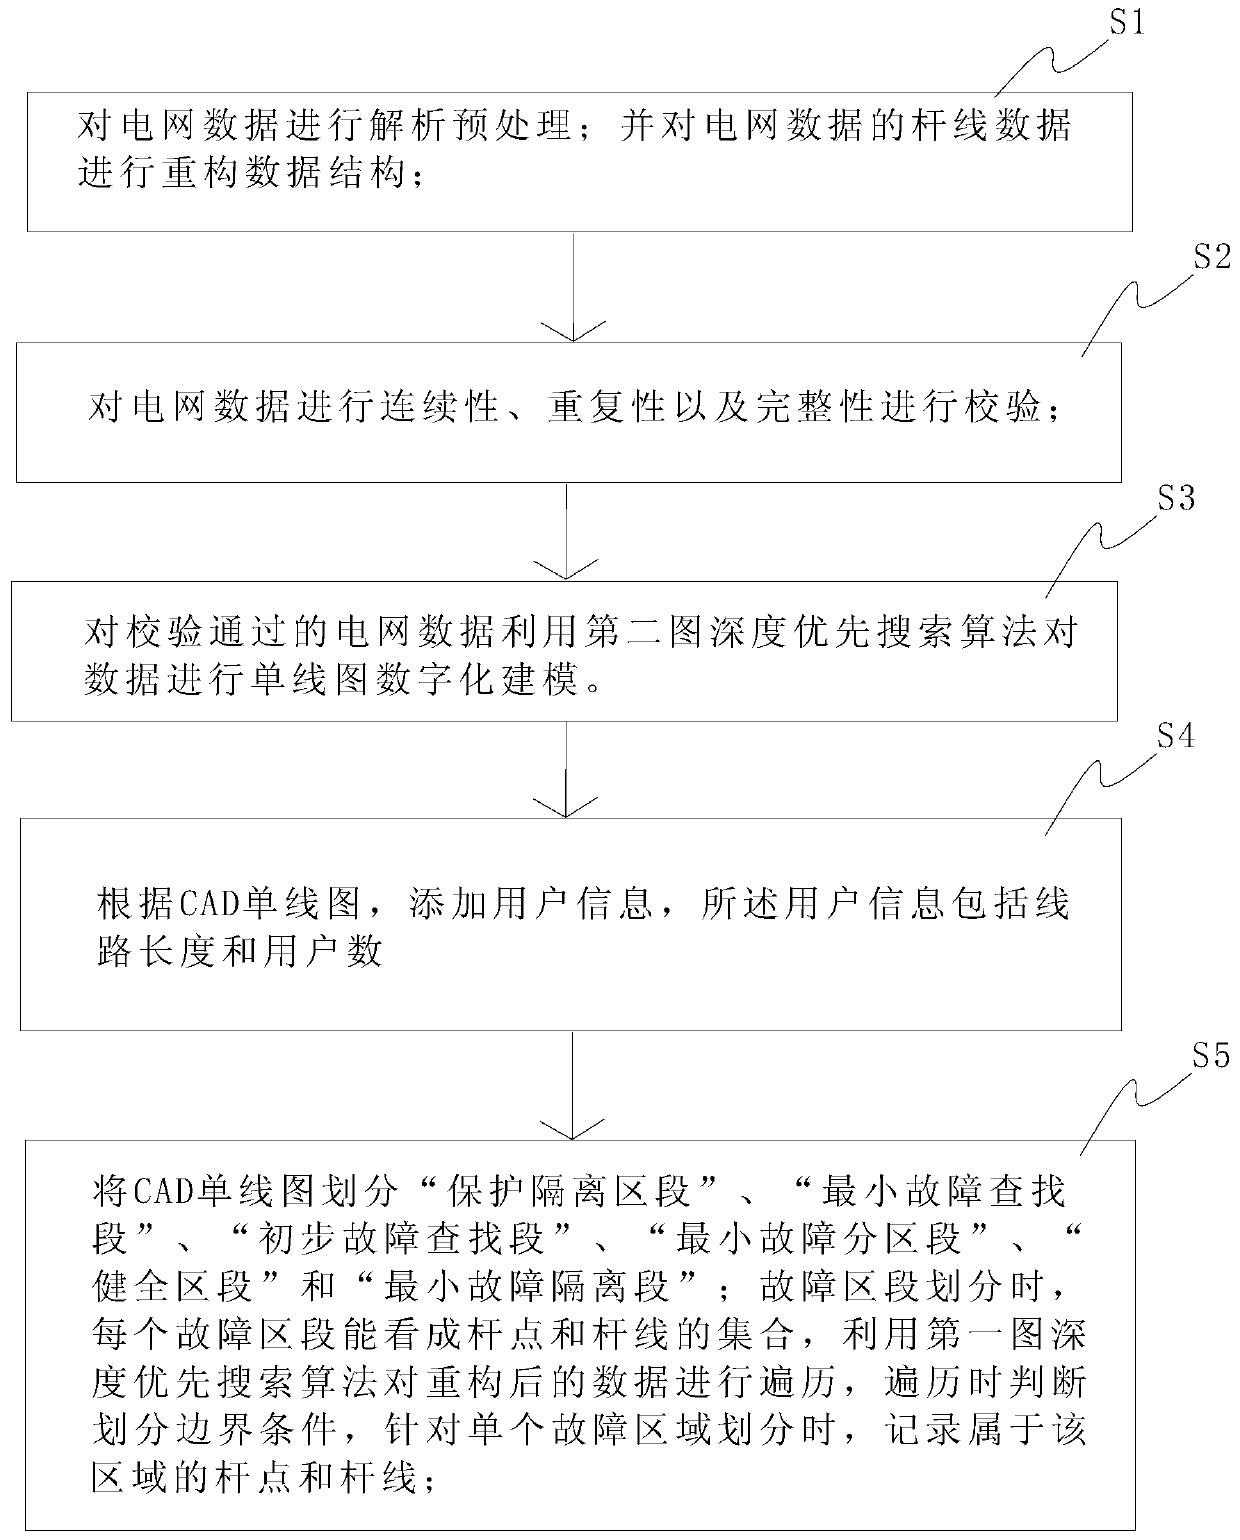
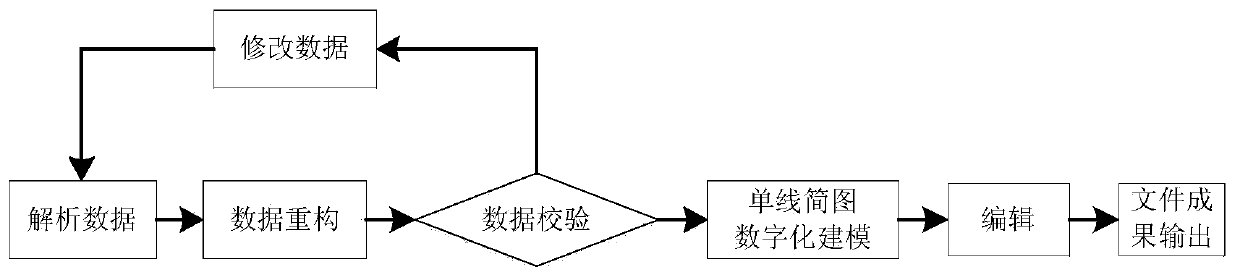
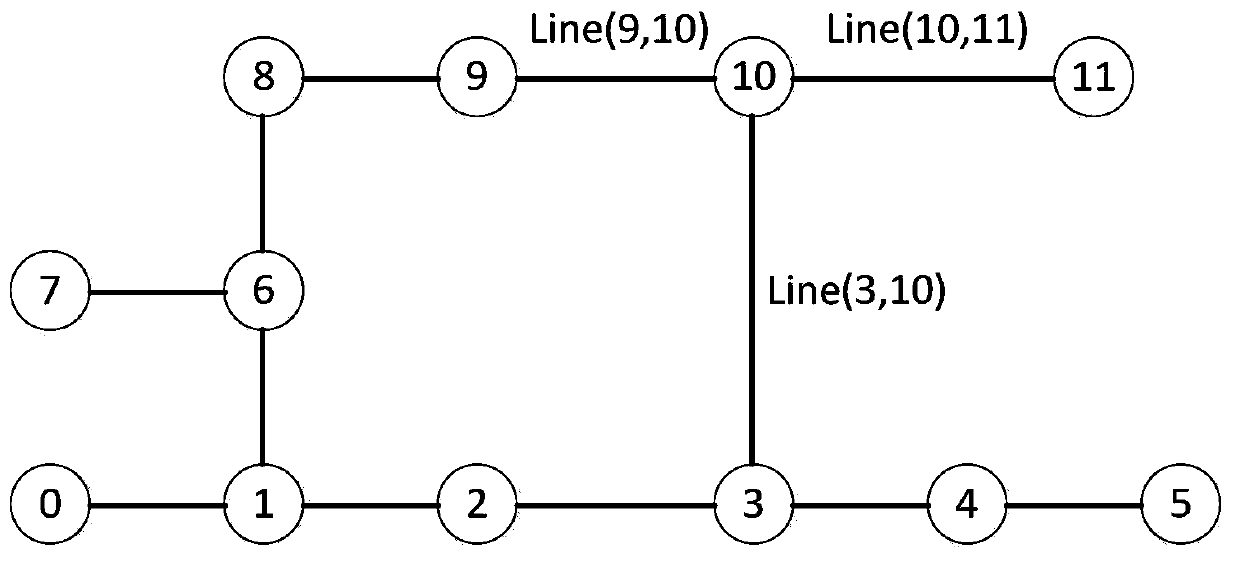
[0092] The present invention combines dwg drawings with user exchange data and information through the visualization (Graphical User Interface) technology to carry out digital modeling. Digital modeling automatically generates single-line diagrams of the power grid, with features such as human-computer interaction, data verification, dynamic editing of parameterized data, and drawing data that can be saved to table data after editing. After the drawing is completed, power supply reliability can be calculated and analyzed; When dividing fault sections, on the basis of digital modeling drawings, using recursive methods, according to the boundary conditions of fault section division at each stage, for the protection isolation section, the minimum fault finding section, the preliminary fault finding section, and the minimum fault isolation section, The minimum fault partit...


PUM


Abstract

The invention provides a visual power distribution network fault section division method. The method includes the following steps: S1, performing analysis preprocessing on power grid data; and performing reconstruction of a data structure on rod line data of the power grid data; S2, performing verification of continuity, repeatability and integrity on the power grid data; S3, utilizing a second diagram depth-first search algorithm to perform single line diagram digital modeling on the power grid data that passes verification, and drawing a CAD single line diagram; S4, according to the CAD single line diagram, adding user information which includes line length and user number; and S5, dividing the CAD single line diagram into a ''protection isolation section'', a ''smallest fault search section'', a ''preliminary fault search section'', a ''smallest fault partition section'' and a ''smallest fault isolation section''. The visual power distribution network fault section division method provided by the invention can enable a design engineer to rapidly and accurately locate and search a fault area and perform fault area division.

Description

technical field [0001] The invention relates to the field of power grid power supply, in particular to technical fields such as computer graphics and electric power engineering, and in particular to a visual fault section division method of distribution network. Background technique [0002] The construction and transformation of distribution network automation is an important basis for the realization of smart grid. In order to adapt to the economic and social development situation, on the basis of considering the existing grid foundation and utilizing existing equipment resources, to meet the higher requirements of users for power supply reliability, and to learn from the technology and management level of advanced power supply enterprises at home and abroad, to accelerate the construction of modern Distribution network, to improve the development quality of distribution network and the practical application level of distribution automation, it is necessary to optimize and...

Claims


Application Information

Patent Timeline
Patent Type & Authority Patents(China)
IPC IPC(8): H02J3/00
CPCH02J3/00H02J2203/20
Inventor 马杰刘泽春
Owner 福建永福信息科技有限公司
Why Eureka
Try Eureka