Method for analyzing environmental quality data by utilizing characteristic radar map
An environmental quality and radar technology, applied in image data processing, 2D image generation, complex mathematical operations, etc., can solve the problem of not being able to see the time series or spatial differences of pollution characteristics, and achieve the effect of rapid cause analysis and display
- Summary
- Abstract
- Description
- Claims
- Application Information
AI Technical Summary
Problems solved by technology
Method used
Image

Examples
Embodiment 1
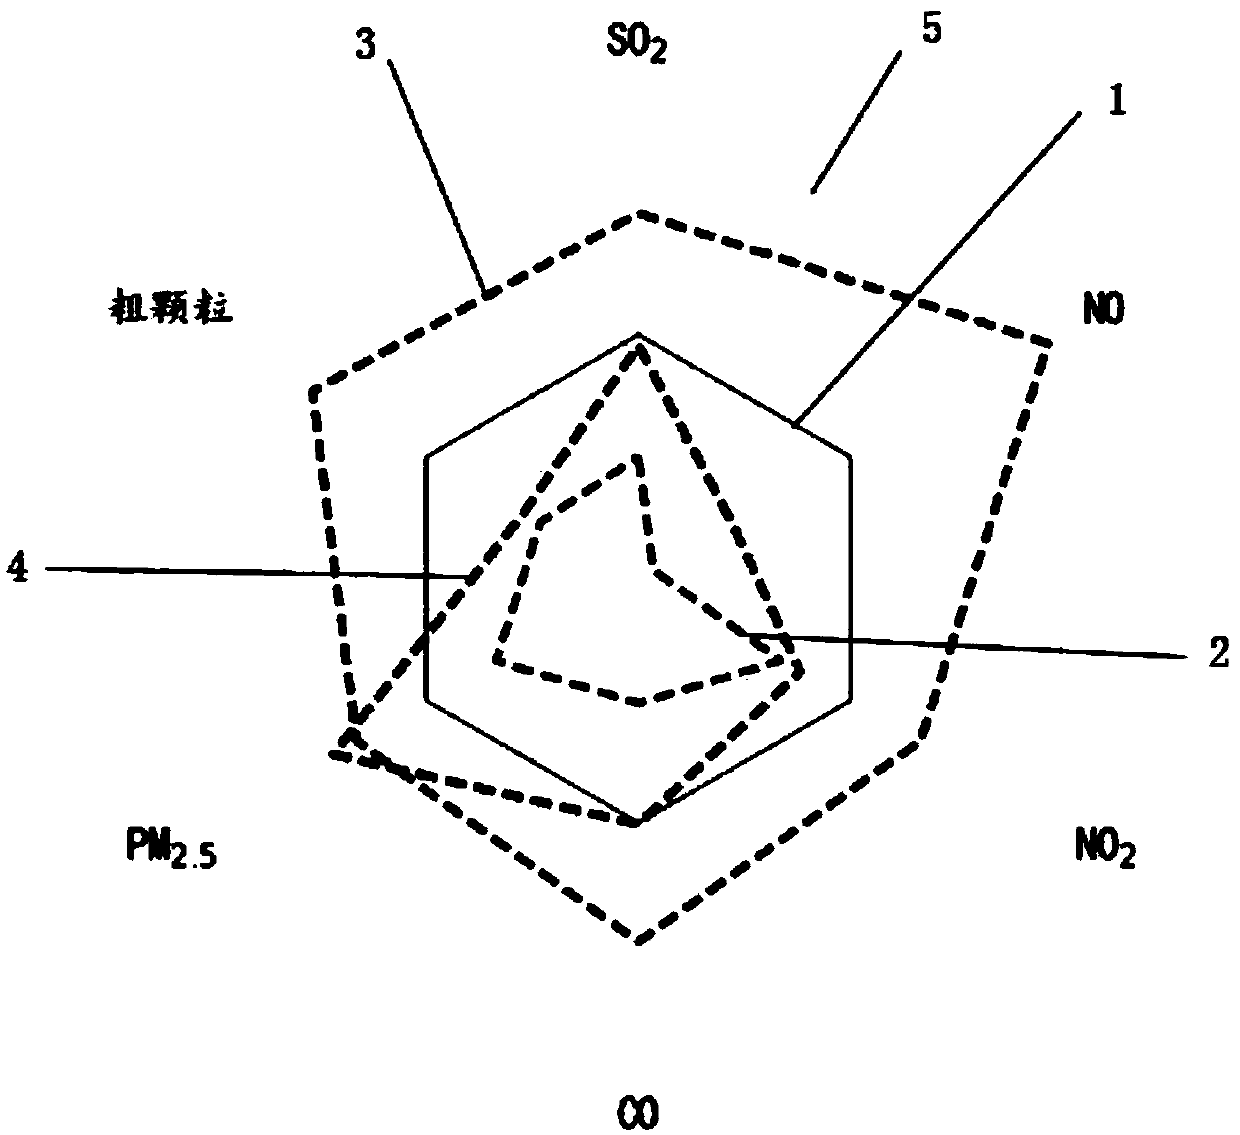
[0052] In this embodiment, the urban air quality of Cangzhou City in 2014 is taken as an example, and the characteristic radar map is used for data analysis. The air quality monitoring data includes PM 2.5 , SO 2 , NO 2 , CO, coarse particles, NO daily average.
[0053] (1) First, normalize the data monitored every day, and PM 2.5 , SO 2 , NO 2 The daily average value of , CO, coarse particles, and NO is converted into a percentage in proportion to form a pollution characteristic component spectrum;
[0054] Its calculation formula is:
[0055]
[0056] Z ij is the normalized value of the jth pollutant at time i;
[0057] Cij is the original concentration of the jth pollutant at time i;
[0058] i is different time;
[0059] j is different pollutants;
[0060] (2) Calculation of PM in the whole year of 2014 2.5 , SO 2 , NO 2 , CO, coarse particle, NO standard value, upper limit, lower limit,
[0061] Among them, the calculation formula of the standard value i...
Embodiment 2
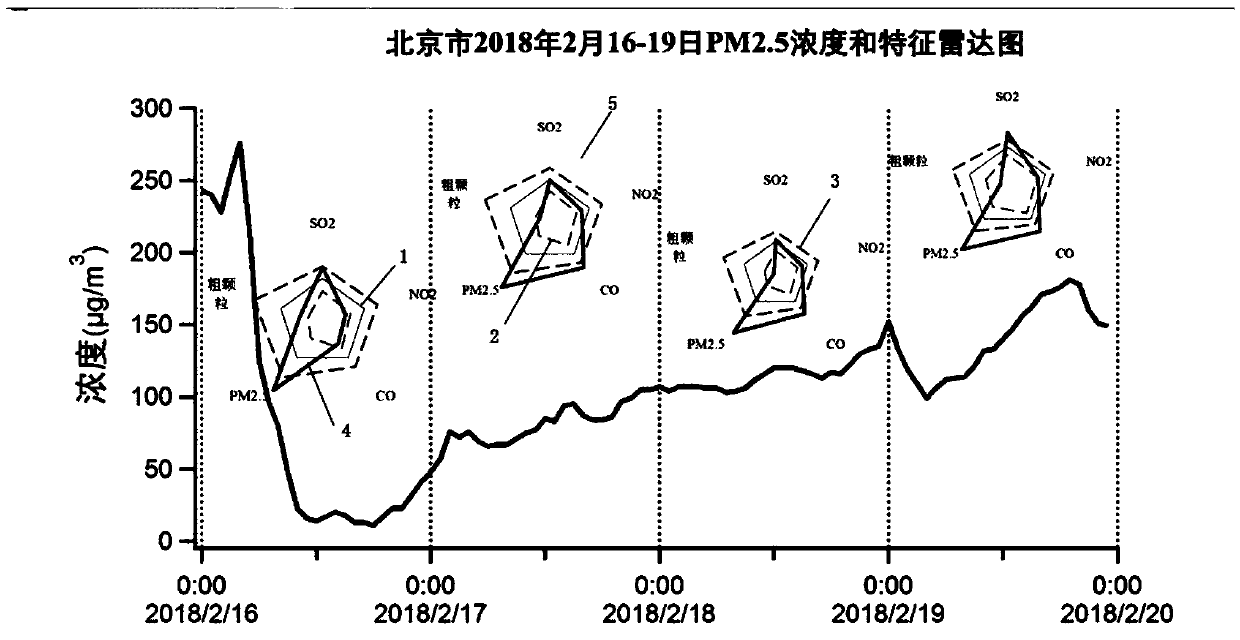
[0094] The five pollutants (coarse particles, SO 2 , NO 2 , CO, PM 2.5 ), and use the radar map to reflect the daily air pollution characteristics, and get image 3 .
[0095] From image 3 It can be seen that Beijing showed typical fireworks emission pollution characteristics (PM 2.5 and SO 2 relatively high proportion); then (from the second day to the fourth day of the junior high school), PM 2.5 While still high, SO 2 gradually decreased, while CO increased, indicating that the impact of fireworks pollution gradually decreased after the second day of junior high school. Another notable feature during this pollution process was coarse particulate matter and NO 2 The relative proportions of all have decreased, indicating that during the Spring Festival, the amount of construction, freight and other activities decreased, reducing the impact of dust and motor vehicle emissions.
Embodiment 3
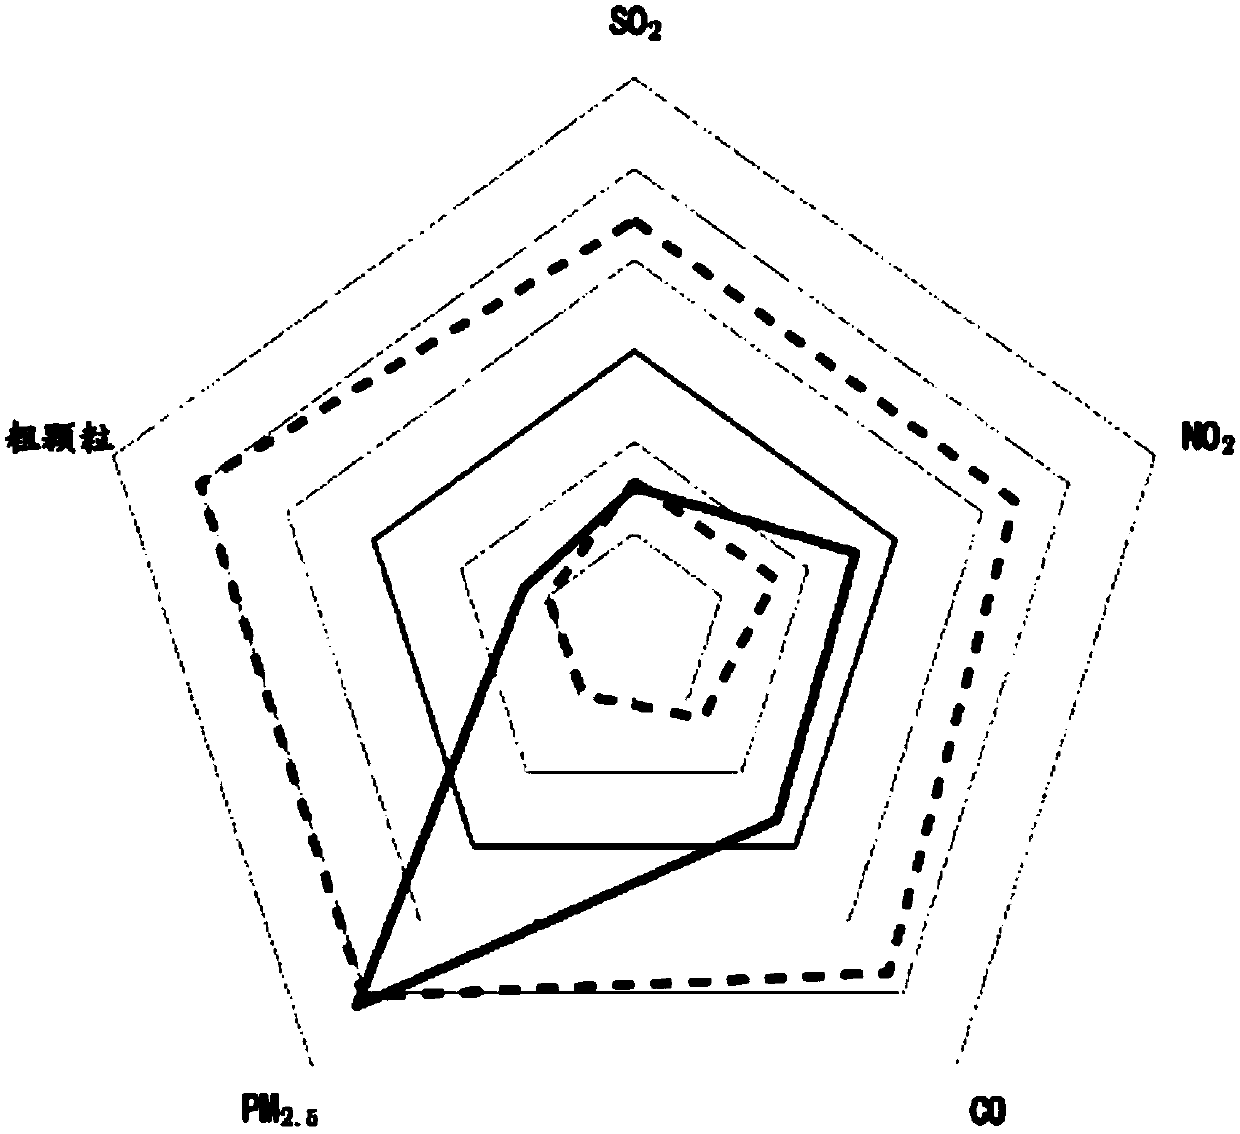
[0097] The same calculation method as in Example 1 was used to analyze the five pollutants (coarse particles, SO 2 , NO 2 , CO, PM 2.5 ), and use radar maps to reflect the air pollution characteristics of different cities on that day, and classify the pollution types of each city.
PUM
 Abstract
Description
Claims
Application Information