Machine learning optimization method, system, computer storage medium and electronic device
An optimization method and machine learning technology, applied in the field of artificial intelligence, can solve problems such as insufficient training data, achieve targeted results, improve performance, and improve labeling efficiency
- Summary
- Abstract
- Description
- Claims
- Application Information
AI Technical Summary
Problems solved by technology
Method used
Image
Examples
example 1
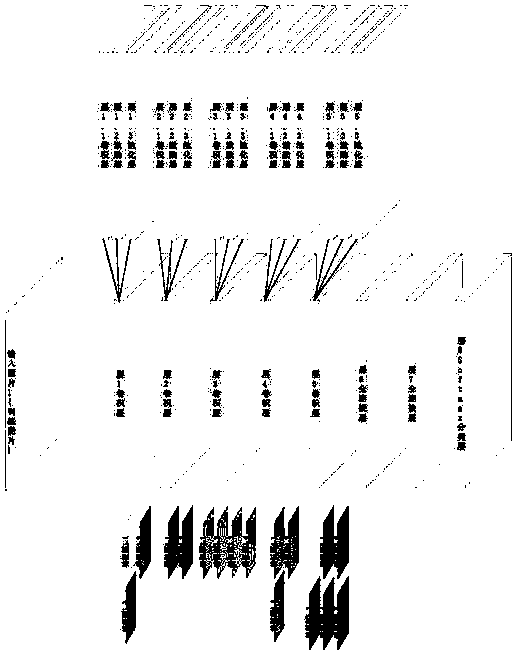
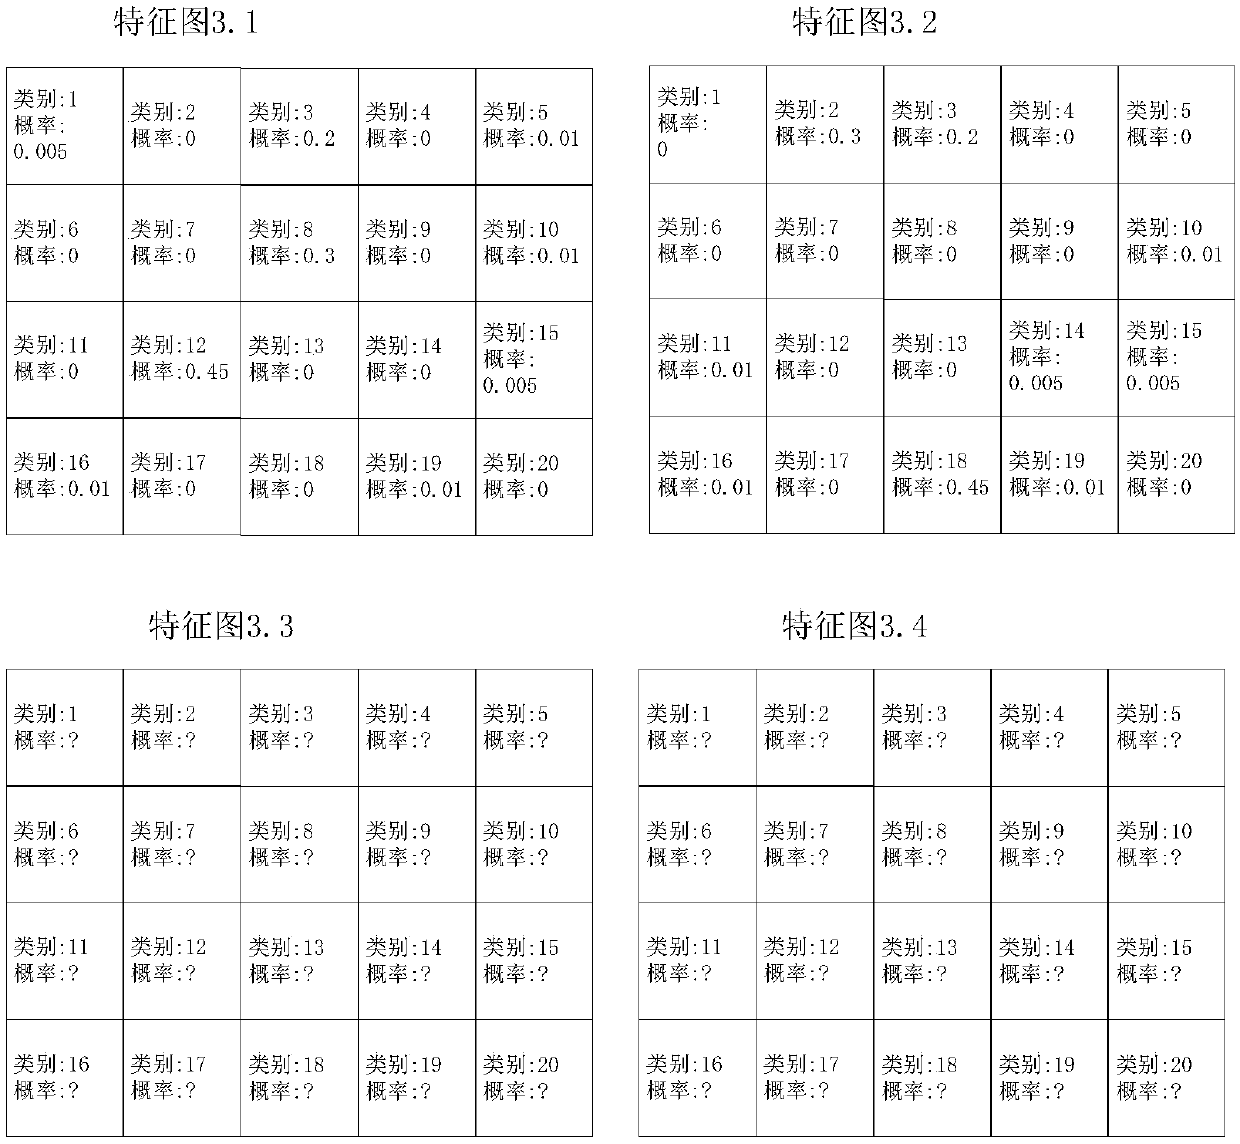
[0093] still with figure 1 Take the convolutional neural network model shown as an example. Get a new picture (hereinafter referred to as the test picture) as input, and input it into the machine learning model that turns on the classification mode after training. The test picture has all the features of the third-layer network. The probability distribution results of the 20 categories obtained in the figure are as follows Image 6 as shown ( Image 6 Only shown with figure 2 distinguishing features image 3 .2, see other feature maps figure 2 ),based on Image 6 The probability distribution results shown in the calculation feature image 3 .1 and characteristics image 3 A standard deviation of .2:
[0094]feature image 3 The standard deviation of .1 is:
[0095] Std Dev(0.005,0,0.2,0,0.01,0,0,0.3,0,0.01,0,0.45,0,0,0.005,0.01,0,0,0.01,0)=0.12203
[0096] feature image 3 The standard deviation of .2 is:
[0097] Std Dev(0.06,0.05,0.04,0.06,0.05,0.05,0.04,0.06,0...
example 2
[0109] by figure 1 Taking the convolutional neural network model shown as an example, input the additionally obtained new test picture 3 into the network with classification mode turned on after training, the following can be obtained: Figure 8 The probability distribution of the feature map shown ( Figure 8 Only shown with figure 2 distinguishing features image 3 .2, see other feature maps figure 2 ):
[0110] Specifically, according to Figure 8 Features shown image 3 .2 Calculate the standard deviation of the probability distribution as follows:
[0111] StdDev(0,0.005,0.2,0,0.01,0,0,0.3,0.45,0,0.01,0,0,0,0.005,
[0112] 0.01,0,0,0.01,0) = 0.12203
[0113] Through the comparison of the above results and the threshold of recognition degree, it can be concluded that: for features with low recognition degree image 3 .2 has a high degree of recognition, so the new test picture 3 is considered to be sample data that can train the model to improve performance sign...
example 3
[0125] Assuming that the training data is 1000 trained pictures, the 1000 trained pictures are sequentially input into the machine learning model that starts the classification mode after training, that is figure 1 The machine learning model is shown, and the statistics of 1000 pictures correspond to each category obtained by all the feature maps extracted by each layer of the network in the first 5 layers of the machine learning model.
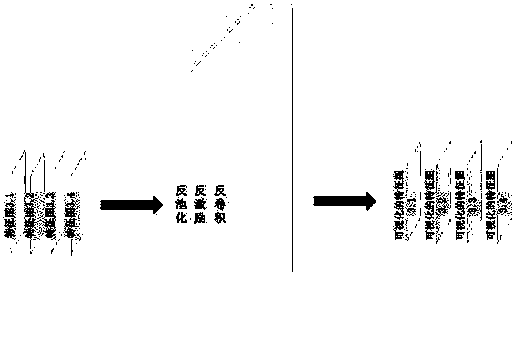
[0126] Taking the first training picture (hereinafter referred to as training picture 1), all feature maps (feature image 3 .1. Features image 3 .2. Features image 3 .3 and features image 3 .4) The obtained categories are as follows: figure 2 Shown:
[0127] feature image 3 .1 The categories obtained include: categories 1, 3, 5, 8, 10, 12, 15, 16 and 19;
[0128] feature image 3 .2 The categories obtained include: categories 2, 3, 10, 11, 14, 15, 16, 18 and 19;
[0129] feature image 3 .3 The acquired categories include: cate...
PUM
 Abstract
Description
Claims
Application Information
 - R&D
- Intellectual Property
- Life Sciences
- Materials
- Tech Scout
- Unparalleled Data Quality
- Higher Quality Content
- 60% Fewer Hallucinations
Browse by: Latest US Patents, China's latest patents, Technical Efficacy Thesaurus, Application Domain, Technology Topic, Popular Technical Reports.
© 2025 PatSnap. All rights reserved.Legal|Privacy policy|Modern Slavery Act Transparency Statement|Sitemap|About US| Contact US: help@patsnap.com


