

Graph simulation matching method for large-scale time sequence graph
A technology for simulating matching and sequence diagrams, applied in the database field, can solve problems such as inability to process sequence diagrams, and achieve the effect of short running time
- Summary
- Abstract
- Description
- Claims
- Application Information
AI Technical Summary
Problems solved by technology
Method used
Image

Examples
Embodiment 1
[0055] A graph simulation matching method for large-scale sequence graphs, comprising the following steps:
[0056] Step 1: According to the obtained existing sequence diagram data, convert the sequence diagram data into a graph storage.
[0057] Step 2: On the timing diagram G=(V,E,L) according to the query graph Q=(V q ,E q , L q ,f e ) for graph simulation matching query. details as follows:
[0058] Step 2.1: Initialization.
[0059] First, the node v∈V in the query graph is q Store it in the pattern, then set the queue to be empty, assign the root to be empty, and the target to be empty.
[0060] Step 2.2: Perform steps 2.3-2.5 for a total of pattern.size cycles from i from 0 to pattern.size-1.
[0061] Step 2.3: Assign pattern[i] to root, V q .next is assigned to target, and root is put into the queue.
[0062] Step 2.4: If the queue is not empty, execute step 2.5 in a loop.
[0063] Step 2.5: Take out the vertex u from the queue, and judge all neighbor nodes ...
Embodiment 2
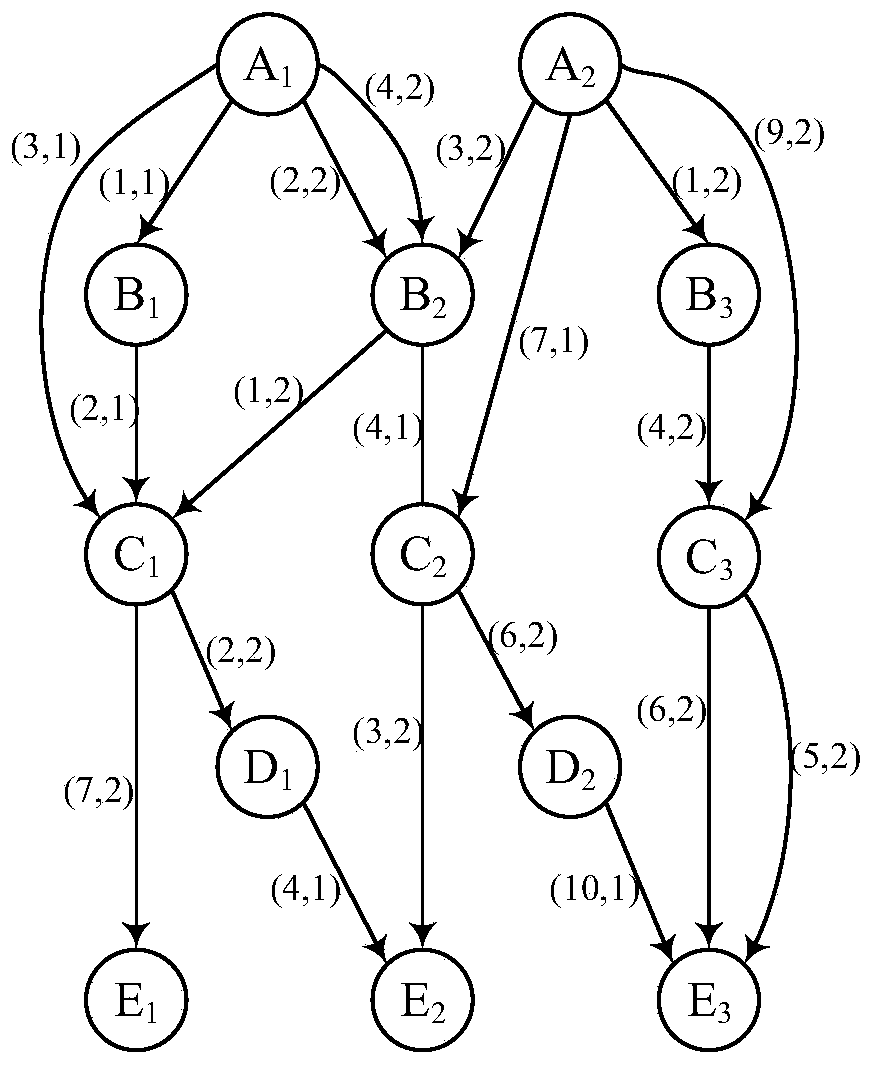
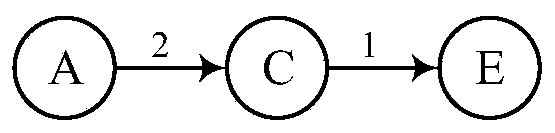
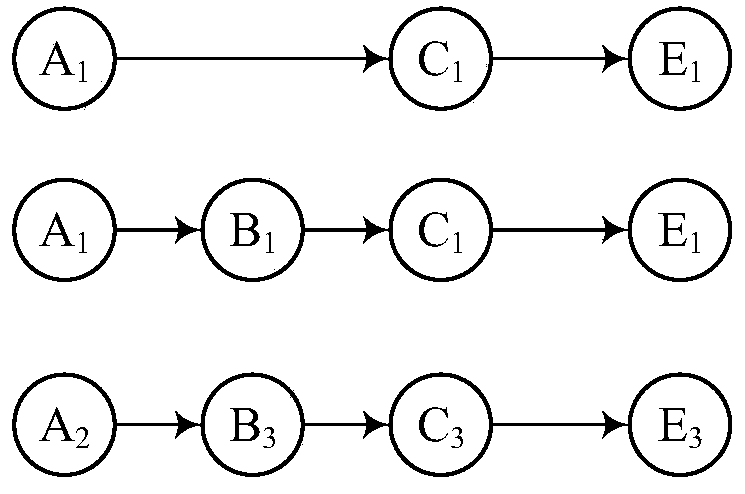
[0070] Combine below figure 1 Describes timing diagrams and related concepts. Such as figure 1 Shown is a timing graph G. The label on the edge between the vertices and the vertices in the figure represents the departure time and elapsed time of the node. For example, the time label on the edge between the vertices A1 and B1 is (1,1), representing The vertex A1 departs from time 1 and arrives at B1 through time 1. figure 2 Shown is the query graph Q, the label on the edge between the vertices in the query graph represents the number of boundaries, that is to say, according to the results found in the sequence graph of the query graph, the number of edges between two points in the query graph The number cannot exceed this boundary number, figure 2 The number of borders on the edge between vertex A and vertex C is 2. image 3 based query graph figure 2 in the sequence diagram figure 1 The results obtained from the timing boundary simulation above.
[0071] This specifi...
PUM
 Abstract
Description
Claims
Application Information