Stratum Matching Visual Analysis Method Based on Multidimensional Logging Data

A technology of logging data and analysis method, applied in the field of data visualization and pattern recognition, can solve the problems of complex heterogeneous geological layering uncertainty, unable to reflect the change trend of different physical properties of the formation, etc.

Active Publication Date: 2022-05-13
ZHEJIANG UNIV OF FINANCE & ECONOMICS
View PDF11 Cites 0 Cited by
  • Summary
  • Abstract
  • Description
  • Claims
  • Application Information

AI Technical Summary

Problems solved by technology

[0005] Multi-dimensional well logging curves reflect the changing trend of different formation physical properties with depth, while the above-mentioned traditional formation matching algorithms often only use a single well logging curve method, which leads to uncertainty in complex heterogeneous geological stratification and cannot reflect Variation trend of different stratum physical properties with depth

Method used


Image

  • Stratum Matching Visual Analysis Method Based on Multidimensional Logging Data
  • Stratum Matching Visual Analysis Method Based on Multidimensional Logging Data
  • Stratum Matching Visual Analysis Method Based on Multidimensional Logging Data

Examples


Embodiment Construction

[0031] Below in conjunction with accompanying drawing, the stratum matching visual analysis method based on logging data of the present invention is further described, and concrete steps are as follows:

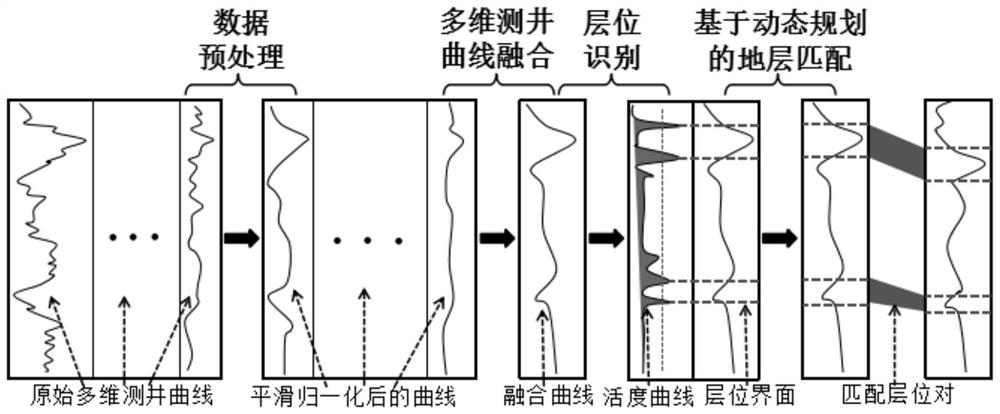
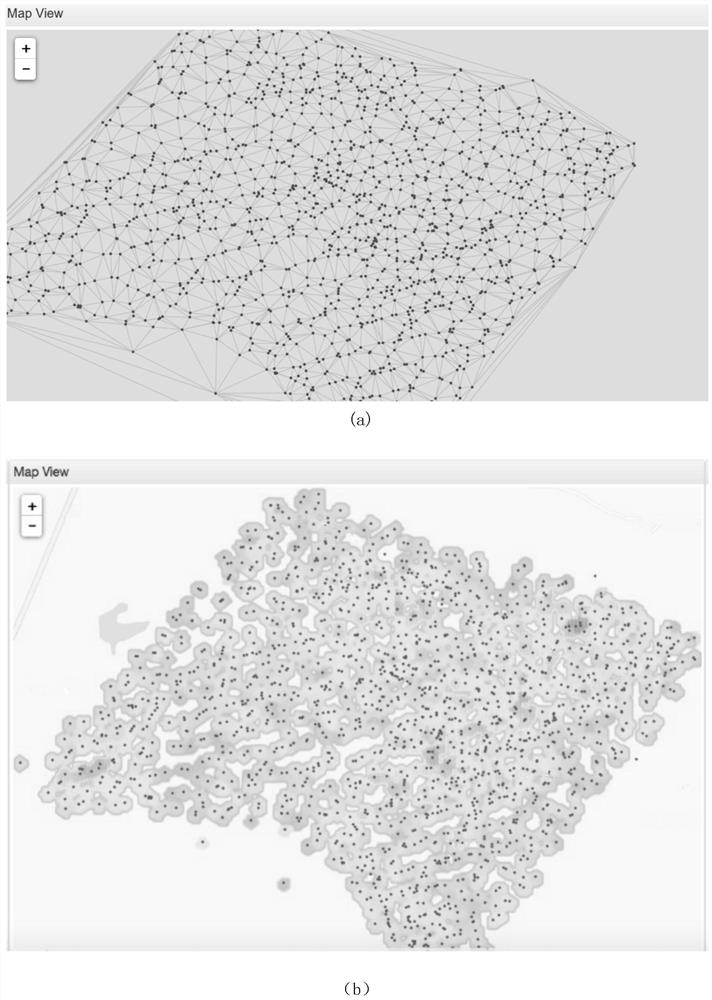
[0032] Step (1): Use the triangulation method to divide all the wells in the target wellfield to obtain the adjacent relationship between the wells, and perform stratum matching for each well in the target wellfield and the adjacent wells one by one according to the adjacent relationship between the wells , every two adjacent wells get a formation matching result. As a preferred embodiment, the present invention performs formation matching through the following steps, the flow chart is as follows figure 1 .

[0033] First, the multidimensional well logging curves formed by the multidimensional well logging data of all two adjacent drilling wells are smoothed, denoised and normalized respectively. Among them, the multidimensional logging curve of each well can be represented...


PUM


Abstract

The invention discloses a stratum matching visual analysis method based on multi-dimensional well logging data, comprising: dividing all wells in the target well field, obtaining the adjacent relationship between the wells, and analyzing each well in the target well field according to the adjacent relationship between the wells. A drilling well is matched with adjacent wells one by one to obtain the corresponding formation matching results; all formation matching results are visualized to obtain a view of the subsurface sedimentary structure of the target wellfield. The subsurface sedimentary structure of the wellfield includes: different formation matching results The difference in similarity between different wells and the depth difference of stratigraphic layers of different wells; select any drilling area from the visualization view, and interact with each of the formation matching results of the selected drilling area with the corresponding visualization view. The invention realizes the visual analysis of the underground sedimentary structure, and can help experts in the geological field and geological exploration enterprises to effectively explore the regional change law of stratum characteristics, reserve estimation and geological structure.

Description

technical field [0001] The invention relates to a stratum matching visual analysis method based on multi-dimensional logging data, which belongs to the technical field of data visualization and pattern recognition. Background technique [0002] At present, the display of underground sedimentary structure is displayed graphically through the stratigraphic matching method, and the visual interactive analysis of underground sedimentary structure has not been realized. [0003] At present, geological data visualization mainly uses seismic data to reconstruct and visualize underground sedimentary structures. After artificial seismic waves are launched into the formation, these seismic data are collected in the form of reflected waves to determine the distribution of the subsurface medium. With the effective acquisition of seismic wave data, visualization technology has been widely used in the field of seismic exploration, and a large number of researches on two-dimensional and t...

Claims


Application Information

Patent Timeline
Patent Type & Authority Patents(China)
IPC IPC(8): E21B49/00
Inventor 周志光
Owner ZHEJIANG UNIV OF FINANCE & ECONOMICS
Why Eureka
Try Eureka