Traffic isochrone visualization application method based on business map open data

A technology of open data and application methods, which is applied in data processing applications, special data processing applications, geographic information databases, etc., and can solve problems such as single-destination requirements and poor travel decisions

Active Publication Date: 2019-07-23
中电科新型智慧城市研究院有限公司
View PDF2 Cites 4 Cited by
  • Summary
  • Abstract
  • Description
  • Claims
  • Application Information

AI Technical Summary

Problems solved by technology

[0004] In related fields, traditional map service providers mainly provide point-to-point commuting methods. Although they can calculate the commuting time between two points, they are limited to a single purpose situation of land demand
However, in the case of multiple destinations or uncertain destinations, as well as within a certain time range or under the condition that the time is as short as possible, the above-mentioned services cannot make travel decisions very well, and more scientific research is needed. , a more intuitive method technology, using the traffic isochrone to show the accessibility within the scope of time and space, making these requirements possible

Method used


Image

  • Traffic isochrone visualization application method based on business map open data
  • Traffic isochrone visualization application method based on business map open data
  • Traffic isochrone visualization application method based on business map open data

Examples


Embodiment 1

[0046] Step 1: Obtain the location data of the existing bus stops in the target area from the commercial map open platform, and then clean, deduplicate, and store the location information as key points in the visualization of the traffic isochronous circle to form a list of key points.

[0047] Step 2, count the number of key points, and calculate the commuting time data between all key points under the bus. Store the commute time data as an n*n matrix to construct a commute time matrix. where n is the number of keypoints and the element T in the matrix PiPj Represents the commute time from the i-th key point Pi to the j-th key point Pj under the bus. In step 2, the commuting time data can also be obtained by using the commercial map open platform to obtain the corresponding commuting time data to construct a commuting time matrix.

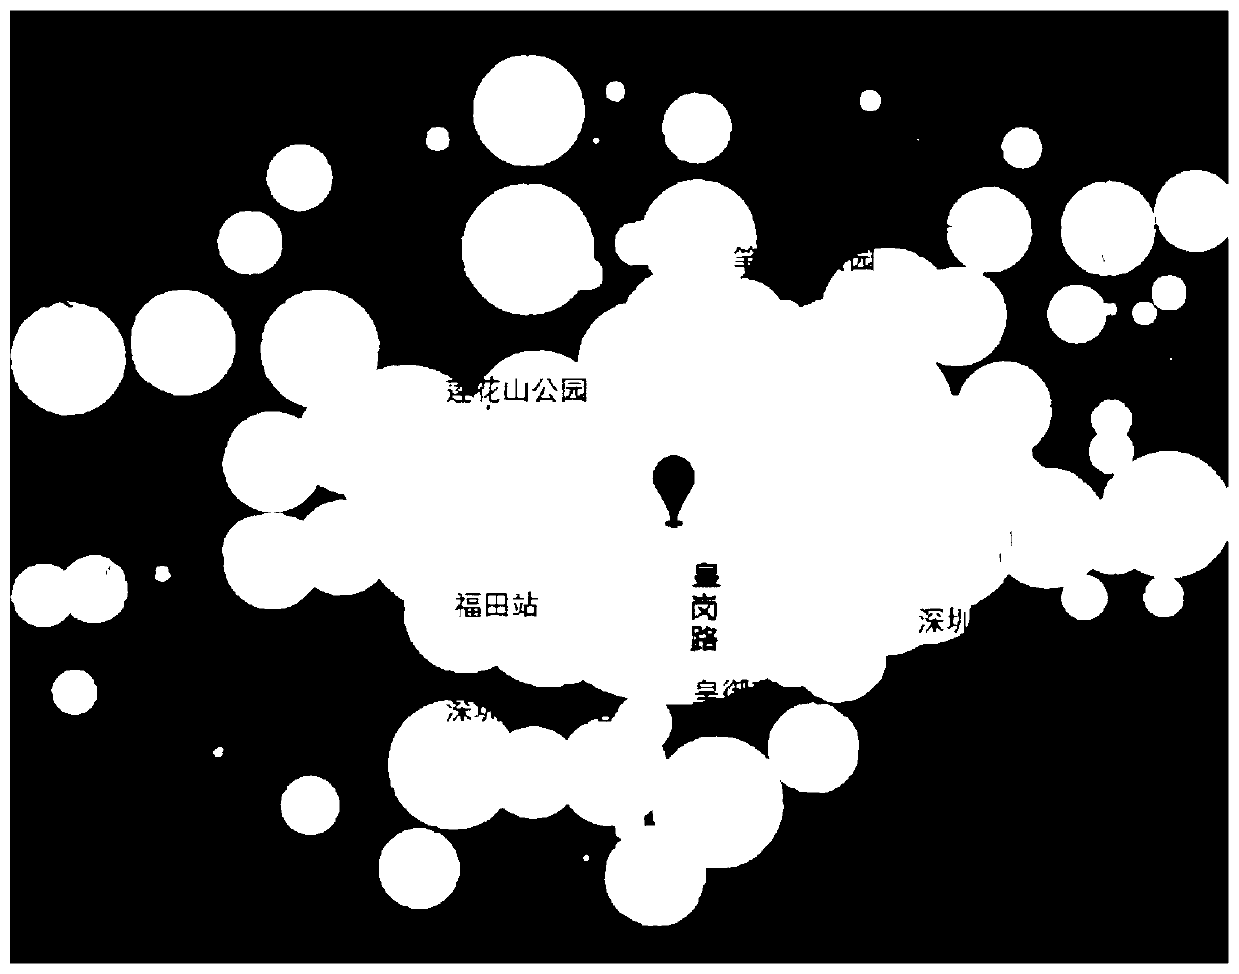
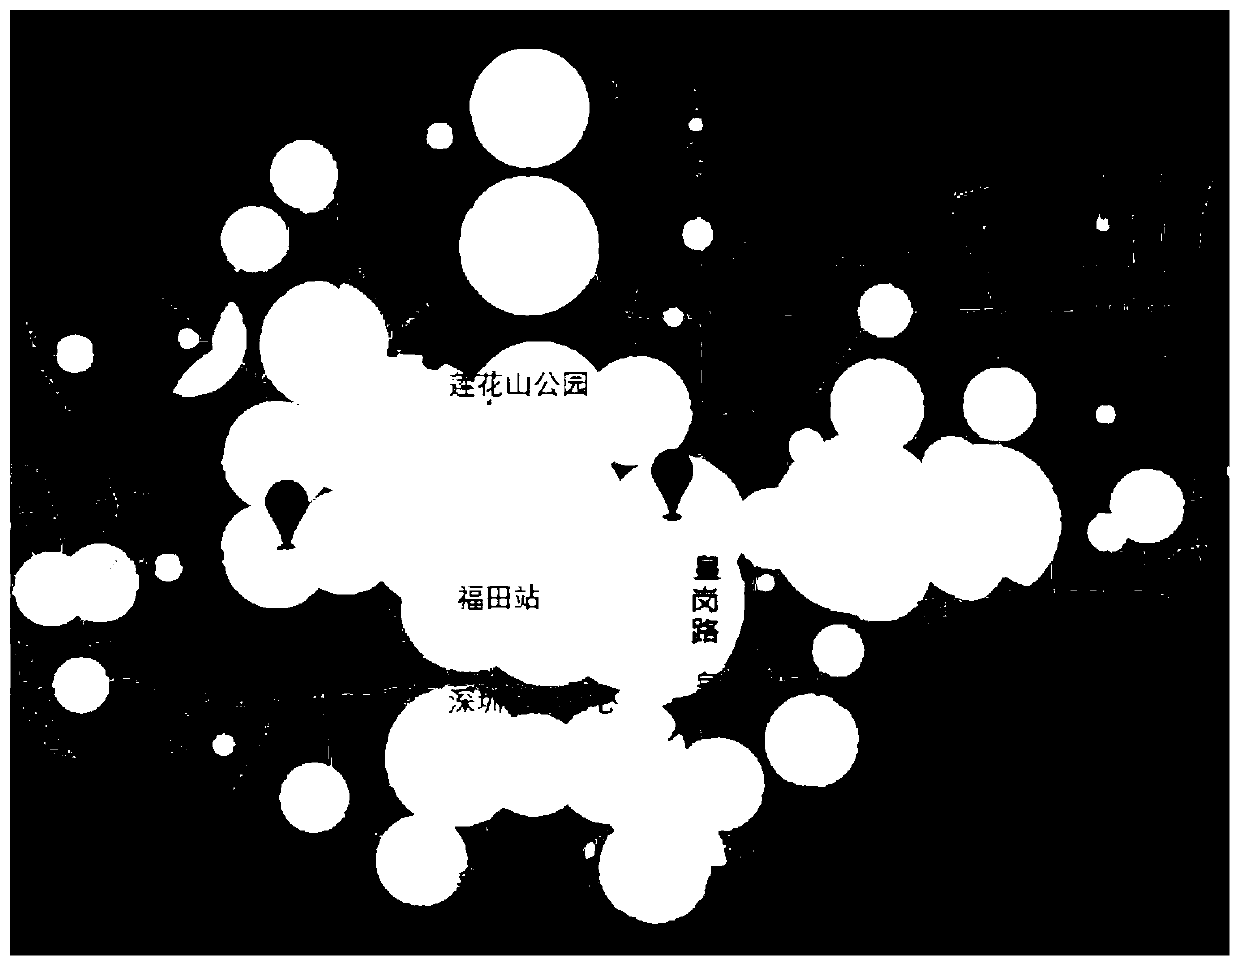
[0048] Step 3, based on the key points and the corresponding commuting time data obtained in steps 1-2, analyze the data, and calculate the rea...

Embodiment 2

[0069] Step 1: Obtain the location data of the existing bus stops and subway stations in the target area from the commercial map open platform, and then clean, deduplicate, and store the location information as the key points in the visualization of the traffic isochronous circle to form a connection with the bus station. The corresponding key point list 1 and the corresponding key point list 2 corresponding to the subway. And the key point list 1 and the key point list 2 can be combined into a key point list 3 to improve the efficiency of key point acquisition in subsequent calculations.

[0070] Step 2, count the number of key points in the key point list 3, and calculate the commuting time data between all the key points under the bus, the subway, or the bus and the subway. Store the commute time data as an n*n matrix to construct a commute time matrix. where n is the number of keypoints and the element T in the matrix PiPj Represents the commute time from the i-th key po...


PUM


Abstract

The invention discloses a traffic isochronism visualization application method based on business map open data, which comprises the following steps: firstly, acquiring position data information of keypoints of urban transportation hubs such as bus stations, subway stations and the like from a business map according to a specified urban area, and forming a key point list; then, obtaining traffic commuting time data between every two key points in the key point list in different traffic modes through the same mode, and forming a commuting time matrix. Then, according to different positions of astarting point and different travelling policies, the reachable range formed by the traffic isochrones is drawn and rendered on a commercial map, and the traffic isochrones visual application based on different travel starting points, different travel times and different vehicles is formed, so that travelers are helped to make corresponding travel strategies for travel demands of multiple destinations or uncertain destinations.

Description

technical field [0001] The invention relates to the technical field of traffic travel planning, in particular to a traffic isochronous circle visualization application method based on commercial map open data. Background technique [0002] With the abundant means of transportation provided by today's cities, citizens can choose from more and more modes of transportation, including walking, cycling, driving, bus, subway, etc. The convenient and fast transportation has greatly expanded the scope of travel for citizens, and certain fringe areas of the city have also become accessible due to the establishment of bus stops or the passage of subways. Based on this, the main cost considered in the travel of citizens has changed from the cost of distance to the cost of time spent on various means of transportation. At the same time, because the spatial distribution of transportation hubs such as bus stations and subway stations has the characteristics of discontinuity and arbitrary...

Claims


Application Information

Patent Timeline
Patent Type & Authority Applications(China)
IPC IPC(8): G06F16/29G06Q10/04
CPCG06F16/29G06Q10/04
Inventor 黄虎吴云洋张宇楠魏晓龙
Owner 中电科新型智慧城市研究院有限公司
Why Eureka
Try Eureka