Laboratory risk target quality control chart drawing method

A target quality and laboratory technology, applied in the field of laboratory risk target quality control chart drawing, can solve the problems of cumbersome requirements, inability to intuitively assess risks, unfavorable promotion and use, etc., and achieve the effect of improving scientificity

Active Publication Date: 2019-08-16
WEST CHINA HOSPITAL SICHUAN UNIV
View PDF3 Cites 0 Cited by
  • Summary
  • Abstract
  • Description
  • Claims
  • Application Information

AI Technical Summary

Benefits of technology

This technology helps keep track on risks by drawing graphs with different dimensions for various types of data (such as financial or medical records). It shows how well these threats were under certain conditions but does not provide any visual confirmation about their impact. Users have access to this graph when they want more precise inspections from specific areas around them. They then calculate the amount of damage caused during testing based upon factors like time-to-reachability, type of problem being addressed, etc., which makes managing high-quality processes easier compared to traditional methods such as manual checks made manually.

Problems solved by technology

The technical problem addressed in these two documents relates to current methods for controlling quality standards such as Multiplex Rule Scheme or Paper on Groundbreaking Protocols without making them complex and confusingly understood through their complexity.

Method used


Image

  • Laboratory risk target quality control chart drawing method
  • Laboratory risk target quality control chart drawing method
  • Laboratory risk target quality control chart drawing method

Examples


Embodiment

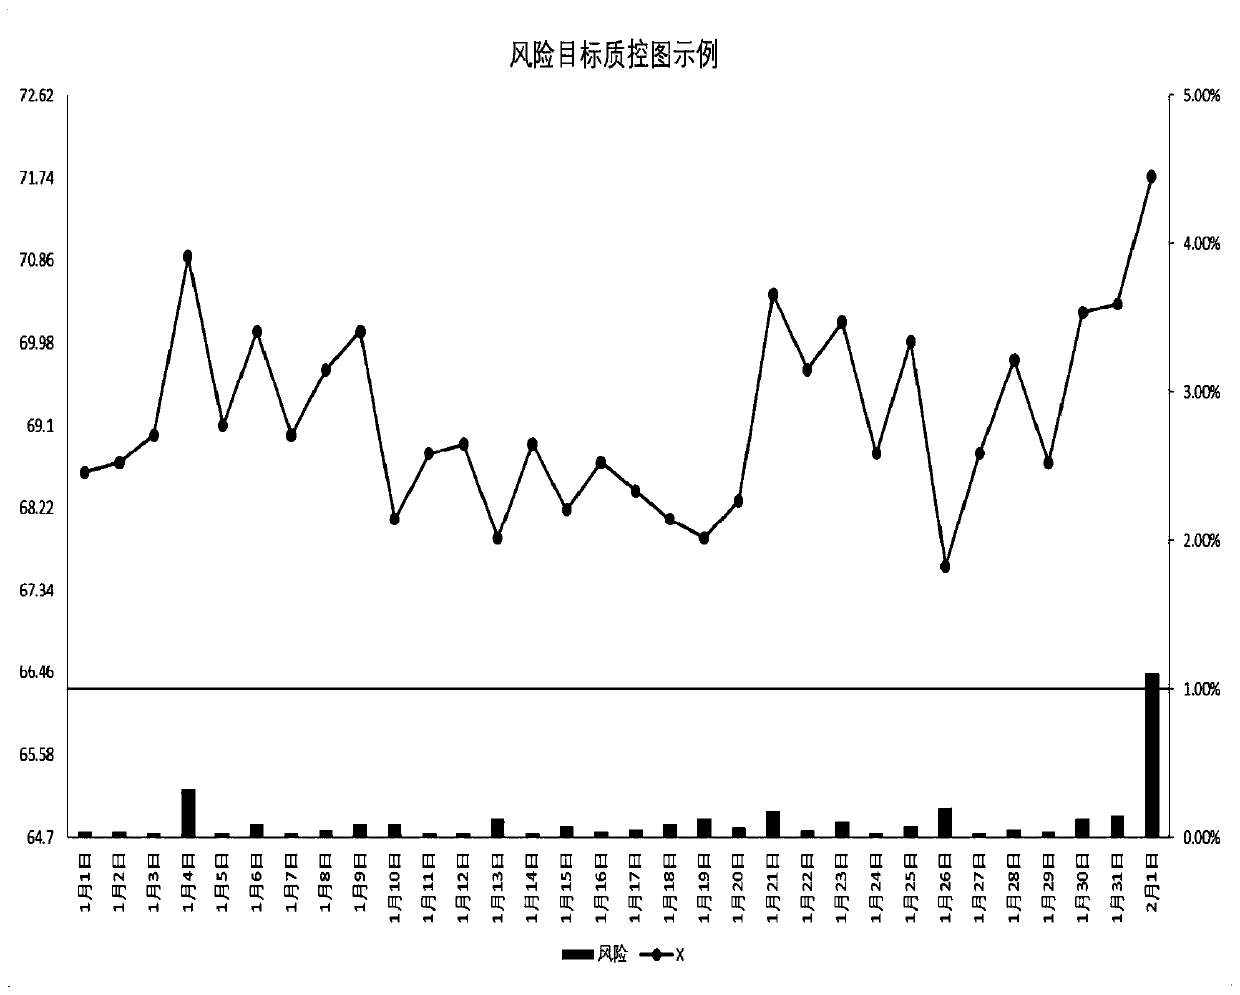
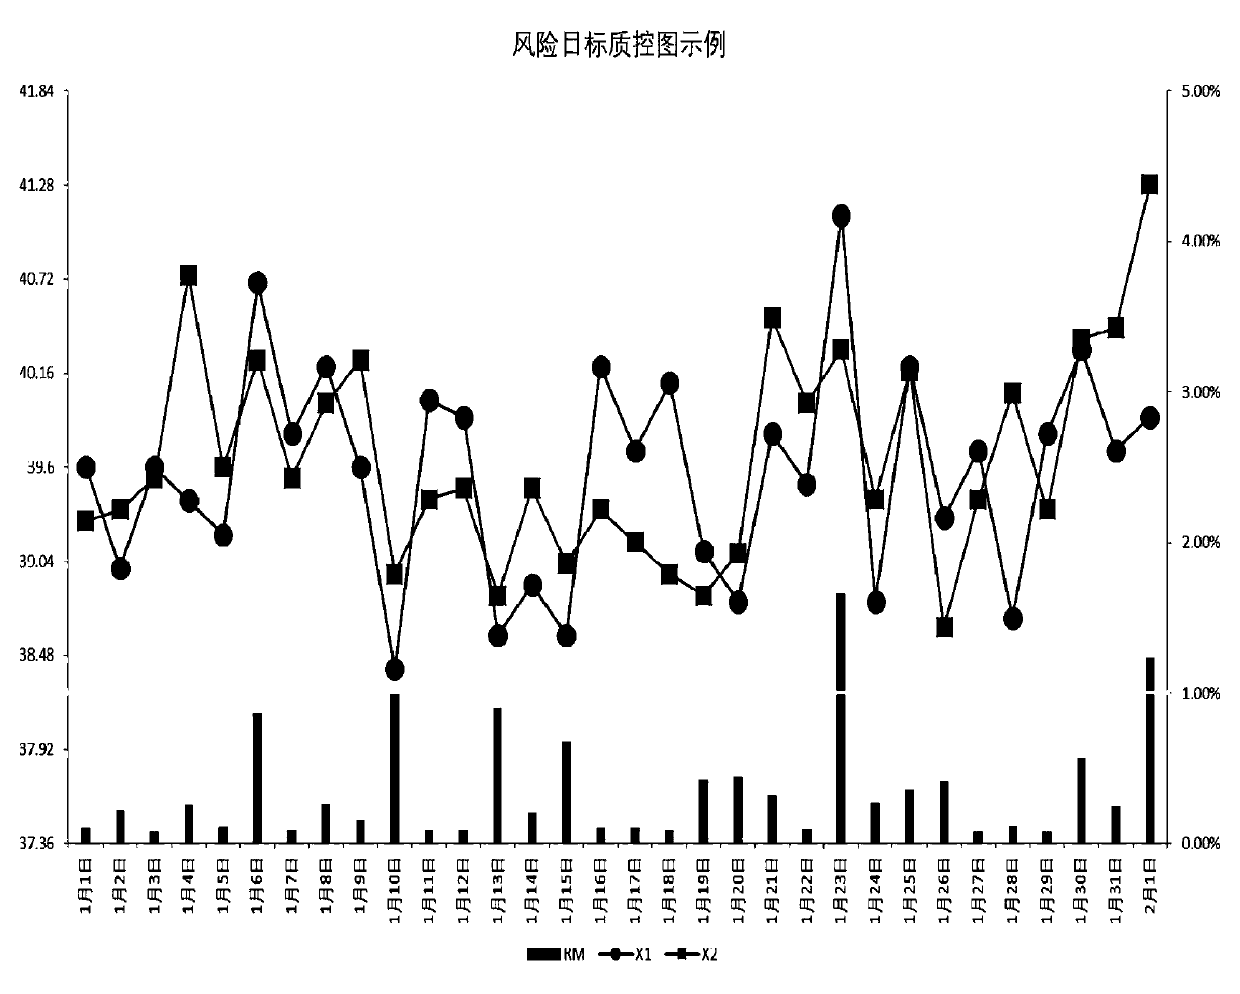
[0055] In this embodiment, the quality control of two levels of concentration is taken as an example, and the drawing process of the quality control chart is as follows:

[0056] (1) Accumulate the results of laboratory albumin determination, using two levels of concentration, level 1 parameter mean 1 = 69.1, s.d. 1 =0.88, parameter mean after level 2 determination 2 = 39.6, s.d. 2 =0.56, allowable total error TEa=6%, bias=0.

[0057] (2), set the risk control line RM cl = 1%, set the acceptable number of samples N exceeding the allowable total error for each analysis batch uc =2.

[0058] (3), calculate and analyze batch length,

[0059] (4), calculate the laboratory short-term sigma value,

[0060] (5) Judging that the sigma values ​​of the two levels are relatively close, the parameters of level 2 are selected for calculation, and the results of each measurement of level 1 are recorded as the repeated measurement results of level 2 through equivalent conversion...


PUM


Abstract

The invention relates to a laboratory risk target quality control technology. The invention discloses a laboratory risk target quality control chart drawing method, and solves the problems that a quality control scheme in the prior art needs tedious rules, the risk in quality control cannot be intuitively evaluated, and risk evaluation schemes proposed by part of researches are complex and are notbeneficial to popularization and application. The method comprises the following steps of: calculating a long-term standard difference value which reflects the long-term stability degree of the laboratory; calculating error distribution parameters of the laboratory; measuring the quality control product when the quality control is implemented each time; obtaining quality control results, calculating an error distribution parameter of the detection system according to the Bayesian theorem; calculating the possibility of existence of different errors, calculating the probability of exceeding the allowable total error when different errors exist, calculating the total risk of the quality control, taking the number of times or days of the quality control as an abscissa, taking the size of thetotal risk of the quality control and a quality control result as an ordinate, drawing a quality control graph, and setting a risk control line in the quality control graph.

Description


Claims


Application Information

Patent Timeline
Owner WEST CHINA HOSPITAL SICHUAN UNIV
Why Eureka
Try Eureka