
Novel graphical description method for power loads

A power load and graphical technology, applied in other database browsing/visualization, special data processing applications, instruments, etc., can solve problems such as inability to distinguish the date of load data, confusion, and difficulty in distinguishing

Pending Publication Date: 2020-03-17
NORTH CHINA ELECTRIC POWER UNIV (BAODING)
View PDF4 Cites 2 Cited by
  • Summary
  • Abstract
  • Description
  • Claims
  • Application Information

AI Technical Summary

Problems solved by technology

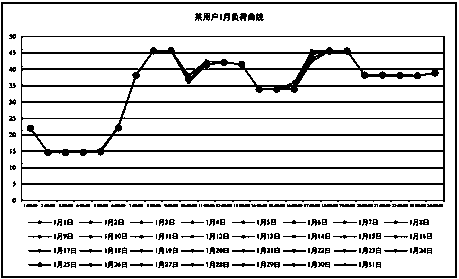
Display the daily load curve of the user in the same daily load curve for one consecutive month as follows figure 2 As shown in the figure, since the load data is accumulated for many days in the figure, although the load curve can show the load change trend, it is no longer possible to distinguish the corresponding date of the load data.
If all the annual loads are displayed on one load curve, it will be more mixed together and difficult to distinguish

Method used


Image

  • Novel graphical description method for power loads
  • Novel graphical description method for power loads
  • Novel graphical description method for power loads

Examples


Embodiment 1

[0051] The sample data source of this embodiment selects an open source data set.

[0052] Select 16 commercial users of various types and sizes, including schools, hospitals, restaurants, etc. Sampling period: from 1:00 on January 1, 2004 to 24:00 on December 31, 2004. Sampling period: 1 hour.

[0053] The implementation steps based on this sample are as follows:

[0054] Step 1: Perform data preprocessing on the power system load data;

[0055] There is no missing data in this sample data, and the sampling time has been sorted in chronological order.

[0056] Step 2: Normalize the load data;

[0057] Loading local normalization is applied to the sample data. Scan the sample load data file from beginning to end to find the maximum load S of the object max and minimum load S min . Then use the normalization formula to calculate the load normalization value θ for each load d arranged in time series.

[0058] Step 3: Convert the normalized load data θ to its correspondi...

Embodiment 2

[0063] The sample data in this embodiment comes from the ElectricityLoadDiagrams2011-2014 Data Set. It covers 96 points of power data from 2011 to 2014 for 370 electricity residential users in a certain area of ​​Portugal. Some users have incomplete data for certain years, and black bands appear on the image. The picture pixel size is 672×210, the horizontal axis represents the load of a week, and the vertical axis represents each week starting from January 1, 2011.

[0064] The invention provides a new method for graphical description of electric load, which designs a conversion method for converting load data into RGB data. Utilizing the sensitivity of human eyes to the hue in the HSV color model, a load image that conforms to human observation is designed based on the hue change. The load image can display the load data of the object at all times in one image, which better presents the law of the user's load. This new load data image description method will help to compl...


PUM


Abstract

The invention discloses a novel graphical description method for power loads, and belongs to the technical field of power quality analysis methods. The method comprises a new graphical description method for the power load, and a conversion method for converting load data into RGB data is designed. The sensitivity of naked eyes of people to the hue in the HSV color model is utilized, and a load image conforming to observation of people is designed on the basis of hue change. According to the load image, the load data of the object at all moments can be displayed in one image, so that the ruleof using the load by the user can be better presented. The new load data image description method is helpful for carrying out load data missing completion, user classification identification, load prediction and the like, is also helpful for applying various latest deep learning methods to an electric power system, is an important supplement to the existing load data visualization, and has very important practical significance.

Description

technical field [0001] The invention relates to a new method for graphical description of power load, and belongs to the technical field of power system load analysis method and data visualization. Background technique [0002] Electric load, also known as "electric load". The sum of the electric power that the electric energy user's electric equipment draws from the power system at a certain moment is called the electric load. According to the different load characteristics of power users, the power load can be divided into various industrial loads, agricultural loads, transportation loads and people's domestic power loads. [0003] Load curves are often used to view load changes over time and to study the regularity of load changes. According to the type of load, it can be divided into active power curve and reactive power curve; according to the length of time period, it can be divided into daily load curve (in units of 1 hour / 15 minutes), monthly load curve (in units o...

Claims


Application Information

Patent Timeline
Patent Type & Authority Applications(China)
IPC IPC(8): G06F16/904G06Q50/06
CPCG06F16/904G06Q50/06
Inventor 王红齐林海林珊
Owner NORTH CHINA ELECTRIC POWER UNIV (BAODING)
Learn More